Electronic chart mapping process
Electronic Chart (ECDIS) is a general term for all kinds of digital charts and their application systems. ECDIS has developed into a new type of ship navigation system and auxiliary decision-making system, which can not only give the ship position continuously, but also provide and synthesize all kinds of information related to navigation, and effectively prevent all kinds of dangerous situations. Chart data will be visual display of points, lines and surfaces, including the diversity and flexibility of information for users to consult.
1.Query point, line and face information of features
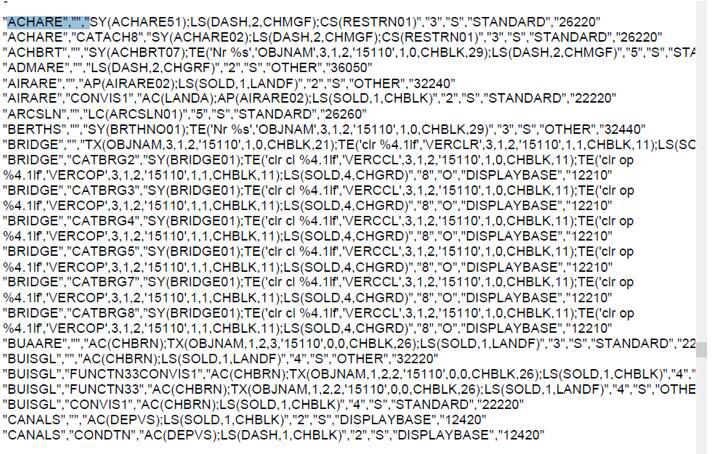
According to the point, line and surface layer name of the chart data, in the  , search in "CS_MD07_Oct09.pdf" such as "ACHARE" to find the relevant information about ACHARE, as shown in the following figure:
2.Query object information of elements
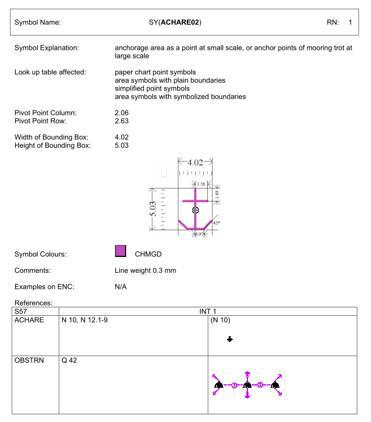
According to the search result "SY (ACHARE02)" in the above figure  "PresLib_e3.4_Part_I_Addendum" for searching again, you can view the relevant information description of the ACHARE point, such as icon meaning, color, shape and size.
3.Query object attribute
From the chart data model, we can see that there is an object mark in the real world entity corresponding model, each object mark has a global identifier and several attributes, and the object mark has a limited number of attributes, the definition, scope, allowable values and definitions of attributes can be queried from the object catalogue. In  has more information about the landmarks, the following is an illustration of the Anchorage landmarks:
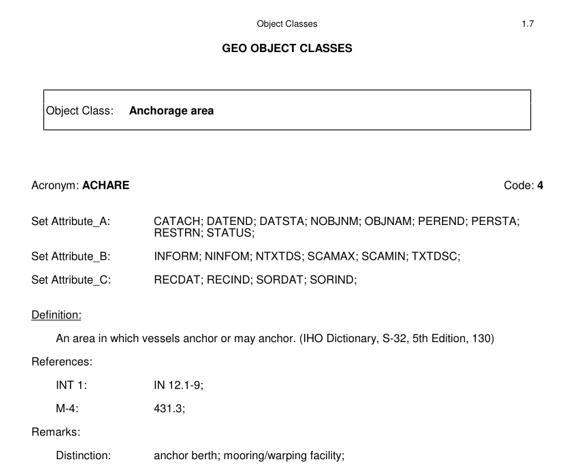
Compared with the above figure, each object mark class is described in the same format, and the meaning of each project is as follows:
- Object class: object class name (Anchorage area Anchorage)
- Acronym: the six-letter code of an object class (ACHARE)
- Code: data is encoded as integers (4: use integers instead of six-letter abbreviations to reduce file size)
- Each object class defines a set of related attributes and is divided into three subsets:
Attribute A: the attributes in this subset define the individual characteristics of an object
Attribute B: the properties in this subset provide information about data usage, such as information related to display or information system
Attribute C: the attributes in this subset provide information about data administration or description.
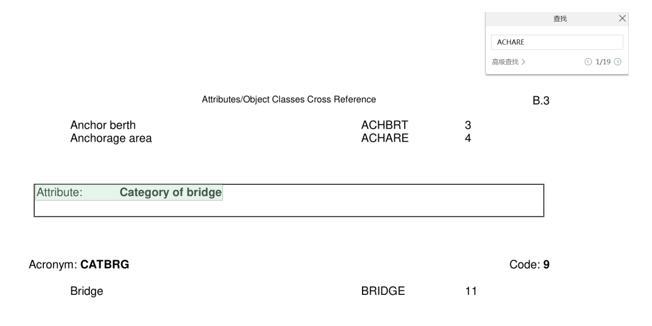
In  Look for the acronym "ACHARE" for anchor objects in, and you can check the ACHARE information for different attribute categories, as shown in the following figure:
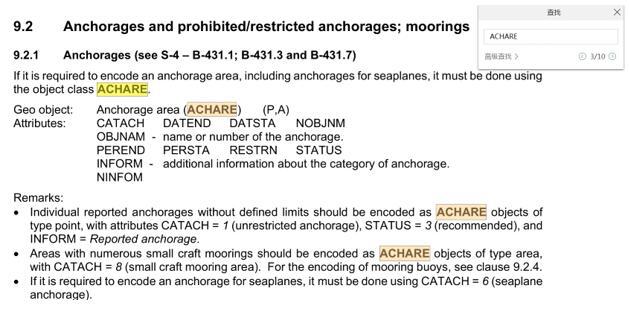
In  you can see the description of the relevant attributes about the Anchorage information in, as shown in the following figure:
4.Display point line face layer
Chart data mainly includes point layer, line layer and area layer. So far, 81 point layers can be displayed, 11 mainly displayed, 77 line layers can be displayed, 11 mainly displayed, 43 face layers can be displayed, and 10 mainly displayed.
(1)Display point layer
The display point layer is relatively simple and contains at least one parameter (symbol name). It is possible to use point symbols for both point objects and surface objects. Dot symbol parameter: example: SY (ACHARE51)
(2)Display line layer
The display line layer refers to the simple linetype to draw the line object. The standard width of the line is 0.32mm according to the Smuri 52 standard. Line symbols are displayed in LS, that is, linetypes described by solid and dashed lines. Example: LS (DASH,2,CHMGD) Meaning: use dashed lines with color CHMGD and width 0.64mm (2 units) to draw.
(3)Display surface layer
The display surface layer is filled with symbols or colors, and the color to be filled may be partially transparent. In the Smuri 52 standard, the transparency of the fill color is only 0% 25% 50% 75%.
Face layer display: AC and AP
- AC is filled with color
Example: AC (CHMGF,3)
Meaning: use 75% transparent color CHMGF to fill the surface object.
- AP is filled with symbols
Example: AP (DQUALA21); LS (DASH,2,CHGRD)
Meaning: fill the area with the symbol DQUALA21 and stroke with a dashed line with a color of CHGRD and a width of 2.
5.Object mapping
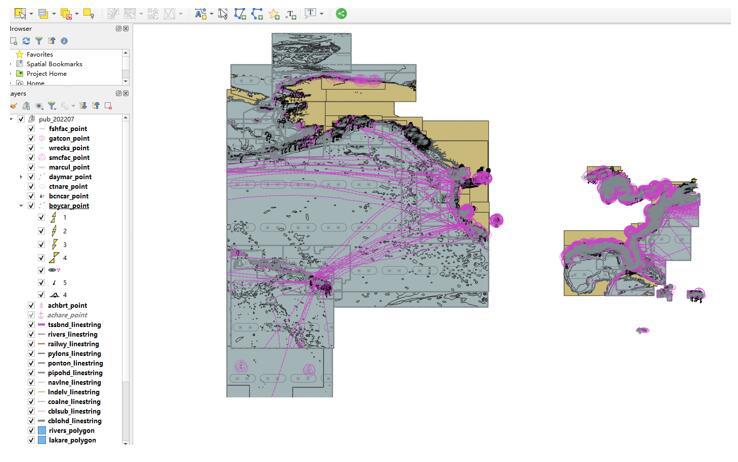
In the early stage of ECDIS data processing, QGIS3.22.7 software is used for mapping, the color of the filling surface, the line type of the displayed line, and the object marks of points and surfaces. However, many object marks do not exist in the QGIS plug-in, and many need to make icons in the later stage.
We used Inkscape to make icons.  Software, and according to
  The color, size and shape of the "PresLib_e3.4_Part_I_Addendum" object and the color of the RGB are drawn, and the object is saved in SVG format and added to the QGIS software and displayed.
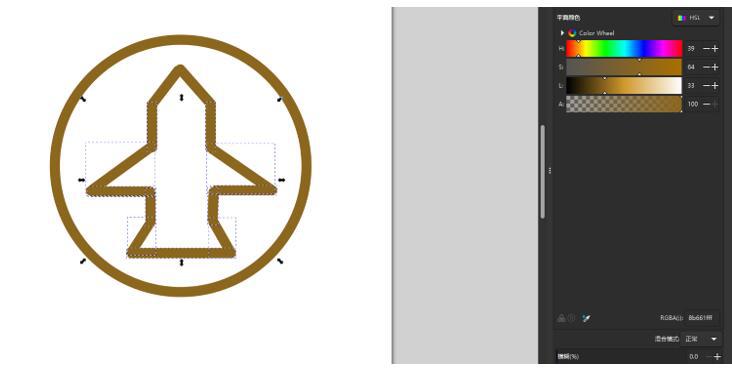
This picture shows the effect of drawing. So far, we have drawn a total of 189 day and night landmarks.