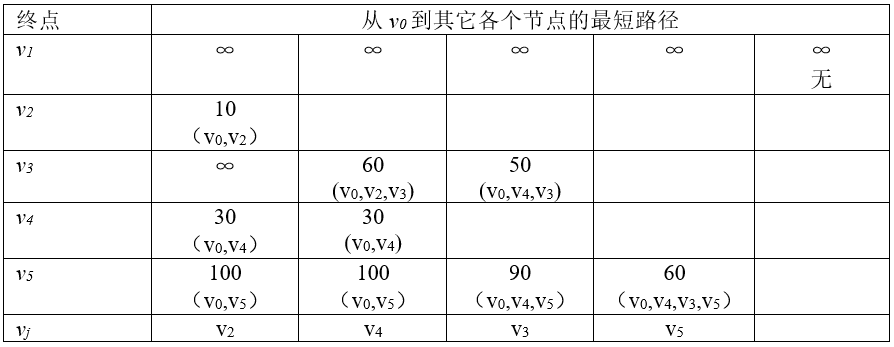
Geographical analysis and modelling of geographic network (such as transportation network), urban infrastructure network (such as various network lines, power lines, telephone lines, water supply and drainage pipelines, etc.) is the main purpose of network analysis function in geographic information system. Network analysis is a basic model in operational research model. Its fundamental purpose is to study and plan how to arrange a network project and make it work best, such as the optimal allocation of certain resources and the lowest transportation cost from one place to another. Its basic idea is that human activities always tend to choose the best space position according to a certain goal. Such problems are numerous in socio-economic activities, so the study of such issues in GIS is of great significance. The basic components and attributes of the network data structure are as follows: 1) Link The state attributes of pipelines flowing in the network, such as streets, rivers and water pipes, include resistance and demand. 2) Node The state attributes of the nodes in the network chain, such as ports, stations and power stations, include resistance and demand. There are several special types of nodes. Barrier, the point that prohibits the flow of chains in the network. Turn, which occurs at the partitioned nodes in the network chain, has resistance to state attributes, such as the time and limitation of turning (for example, no left turn is allowed between 8:00 and 18:00). Center is the location where resources are accepted or allocated, such as reservoirs, commercial centers, power stations, etc., and their status attributes include resource capacity (such as total amount), resistance limit (center to chain maximum distance or time limit). Stop, the node of resource increase and decrease in path selection, such as warehouse, station, etc., its state attribute has resource requirements, such as the number of products. In addition to the basic components, some special structures are sometimes added, such as adjacent link lists, to assist in path analysis. Statically find the best path: Given the attributes on each chain, find the best path. N optimal path analysis: determine the starting point or the end point, and find the N path with the lowest cost, because in practice, the choice of the best path is only an ideal situation, because of various factors, the approximate optimal path should be chosen. The shortest path or the lowest consumption path: determine the starting point, the end point and the intermediate point and the middle connection to go through, and find the shortest path or the lowest consumption path. Dynamic Optimal Path Analysis: The weight of the actual network varies with the weight relationship, and there may be temporary obstacles, which require dynamic calculation of the optimal path. In order to analyze the shortest path of a network, it is necessary to transform the network into a directed graph. Whether it is to calculate the shortest path or the best path, the algorithm is consistent, the difference is that the weight of each arc in the digraph is set. If the shortest path is to be computed, the weight is set to the actual distance between the two nodes, and to calculate the best path, the weight can be set to the time or cost from the starting point to the end point. Dijkstra algorithm can be used to calculate the shortest path from any node in the digraph to other nodes. The following is a description of the algorithm. 1)用带权的邻接矩阵 Fig. 123 Weighted digraphs and adjacency matrices # Then, introduce an auxiliary vector Let 2)选择 \(v_j\) is the endpoint of the current shortest path starting from \(v_i0\) , let \(S=S∪{v_j}\) 3)修改从 v_i0 出发到集合 V-S 中任意一顶点 v_k 的最短路径长度。如果 Dist[j]+Cost[j,k]<Dist[k] Then modify Dist[k] to: Dist[k]=Dist[j]+Cost[j,k] 4)重复第2、3步操作共 n-1 次,由此求得从 v_i0 出发的到图上各个顶点的最短路径是依路径长度递增的序列。表8-1是图8-14根据Dijkstra计算的结果。 Table 8-1: Results calculated with Dijkstra algorithm Fig. 124 Results calculated with Dijkstra # In practical applications, the Dijkstra algorithm is used to calculate the shortest path between two points and the time required to find the shortest path from one point to all other points, the algorithm time complexity is O(n :sup:`2` ) . The resource allocation network model consists of a central point (distribution center or collection center) and its attributes and networks. There are two forms of distribution: one is from the distribution center to the surrounding area, the other is from the surrounding area to the collection center. The application of resource allocation includes the distribution of fire stations and the division of rescue areas, the location of schools, the distribution of garbage collection sites, and the estimation of the social and economic impact of water and power outages on the region. 1) Load design Load design can be used to estimate whether the drainage system overflows during the rainstorm and whether the transmission system is overloaded. 2) Time and distance estimation In addition to traffic time and traffic distance analysis, time and distance estimation can also simulate the distance loss of resources such as water and electricity or energy on the network. The specific categories, objects and requirements of network analysis vary greatly, generally, GIS software can only provide some commonly used analysis methods, or provide data models describing the network and databases for storing information. The most commonly used method is the linear impedance method, that is, the transportation of resources on the network is linearly proportional to the resistance and distance (or time). On this basis, path selection, load estimation, resource allocation, time and distance calculation are carried out. For special networks with high precision and non-linear impedance, special algorithm analysis is needed.Network data structure #
Main network analysis functions #
Path analysis #
Dijkstra algorithm for calculating the shortest path #
Cost
来表示带权的
n
个节点的有向图,
Cost[i,j]
表示弧
<v_i,v_j>
的权值,如果从
v_i
到
v_j
不连通,则
Cost[i,j]=∞
。图表示了一个带权有向图以及其邻接矩阵。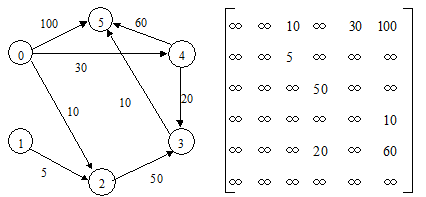
Dist
, and each component
Dist[i]
represents the shortest path length from the starting point to each end point
v_i
. Assume that the starting point is in the directed graph with the number
i0
and set the initial value of the vector to be:Dist[i]=Cost[i0,i] v_i ∈V
S
be the collection of the end points of the shortest path from the starting point that have been found.
V_j
,使得*Dist[j]=Min{ Dist[i]*\ \|\ *V_i ∈V-S} v_i ∈V*
Resource allocation #