Mapshaper data classification command - classify parameter details and usage
About the classify command
Use common data classification methods (such as quantiles, equal spacing, etc.) to assign colors or other data to specific attribute fields.
Option Parameters
<field> or field= Specifies the name of the data field used for classification.
Save as= Field name of the classification result output. The default output field name for colors is fill or stroke (depending on the geometry type), and the output field name for non colors is class.
Values= List of values used to assign to the data class. If the number of values differs from the number given by the classes or break options, interpolation is calculated. Mapper uses d3 for interpolation.
Colors= Sets the color generation scheme, which can be a CSS color list, a predefined color scheme, or a random scheme. Run the - colors command to list all built-in color schemes. Similar to the values= option, if the number of colors listed differs from the number set by the user, the interpolated colors are calculated.
non-adjacent assigns colors to face layers in a random manner, trying not to assign the same color to adjacent faces. Mapshaper's algorithm is relatively balanced, and can usually be completed in four or five colors. If mapshader cannot avoid giving the same color to adjacent polygons, it will print a warning, which can be resolved by increasing the number of colors.
Stops= Comma separated number (0-100) used to limit the output range of the color band.
Range= Comma separated number representing the minimum and maximum data values for classification. (By default, the minimum and maximum values of the classified data fields are used.).
null-value= The value (or color) of invalid or missing data.
Classes=The number of data classes. If not set, Mapper will also infer from the break=or values=options.
Breaks= User manually defined classification data breakpoints.
Method= Set the classification method. Options include: quantile, equal interval, nice, hybrid (sequence data), categorical, non-adjacent, and indexed. If the mapshaper can be inferred from other options, you can also leave this parameter unspecified. For example, the index field= parameter is equivalent to specifying an indexed classification method, and the categories= parameter is equivalent to specifying a categorical classification.
Quantile uses quantile classification, which is equivalent to method=quantile.
Equal interval uses equal interval classification. Equivalent to method=equal interval.
nice is equivalent to method=nice. This classification method can find breakpoints with equal intervals and roughly divide the dataset into equal parts (similar to quantile classification).
invert Reverses the order of colors or values.
Continuous output continuous interpolation is currently an experimental function. Using linear interpolation between classification intervals does not provide ideal results for some distributed data.
index field= Use the category ID that has been pre calculated and assigned to this field. The value should be 0 An integer of n-1 (where n is the number of classes)- 1 is a null value.
Precision= Rounding data values before classification (e.g., precision=0.1).
Categories= List of values in the source data field. Use this option to automatically use categorical classification.
Other= The default value for the categorical category. This value is used when the value of the source data field does not appear in the list of values given by categories=. The default is null value= or null.
Usage examples
mapshaper shandong.geojson -classify save-as=fill quantile colors=Oranges classes=6 field=renkou2 -o out.geojson
The results are shown in the figure:
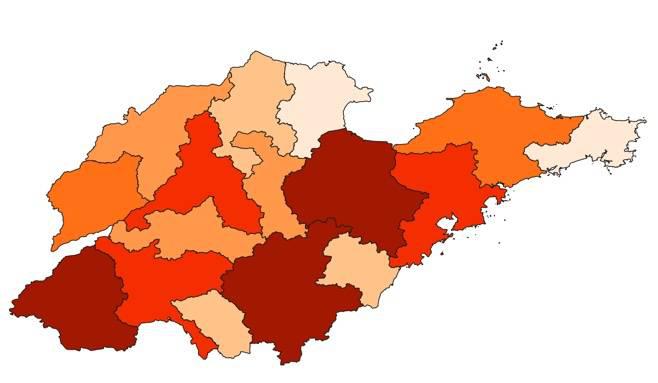
PS: The classification colors in the generated data are placed in the fill field, and there are two ways to view them.
One is to use Mapshaper's official website https://mapshaper.org/, and upload the generated out.geojson. Another way is to use QGIS.