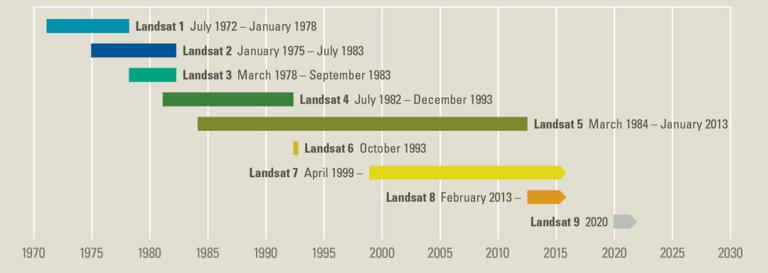
Abstract: Preface In the past 50 years, Landsat series satellites have provided us with very long time series of earth surface observation ...
Preface
In the past 50 years, Landsat series satellites have provided us with very long time series of earth surface observation information. At this stage, Landsat satellites are still in service, providing very valuable data for global governance and scientific research.
Now is the era of big data, as the field of geoscience, remote sensing data is absolutely valuable first-hand measured data, and the amount of data is very huge. At this stage, it is possible that the production speed of most of the remote sensing data is much faster than that of us to use it, so most of the remote sensing data are still in a state of deep sleep, waiting for the technological innovation to awaken the sleeping data and make it glow and heat.
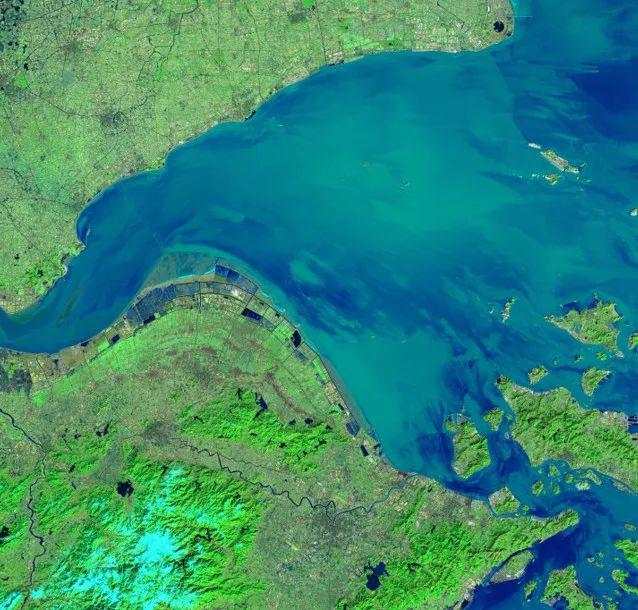
Today we will explore the use of Landsat data to make a remote sensing image. The picture below shows Hangzhou Bay.
1.Preparation
First prepare the downloaded Landsat8 data set.
The Landsat8 includes 11 bands, one for each band in the data folder.
tif File, this tif file includes coordinate information,
wave band value and other information,
which can be obtained through the Python Of rasterio Module (if necessary, you can write more about using this library to read tif file information).
Import the Python library that you will use next.
Import numpy as np
Import os
Import matplotlib.pyplot as plt
Import tifffile as tiff
From skimage import exposure
When using remote sensing image to make base map, the data of three bands are usually selected as the three channels of image RGB, in which RGB represents three channels of red, green and blue. Different band combinations will get different results.
We use a lot of Google earth to use Landsat data, and his band combination is 432. Even the B4, B3 and B2 bands of Landsat are used as the three channels of the image.
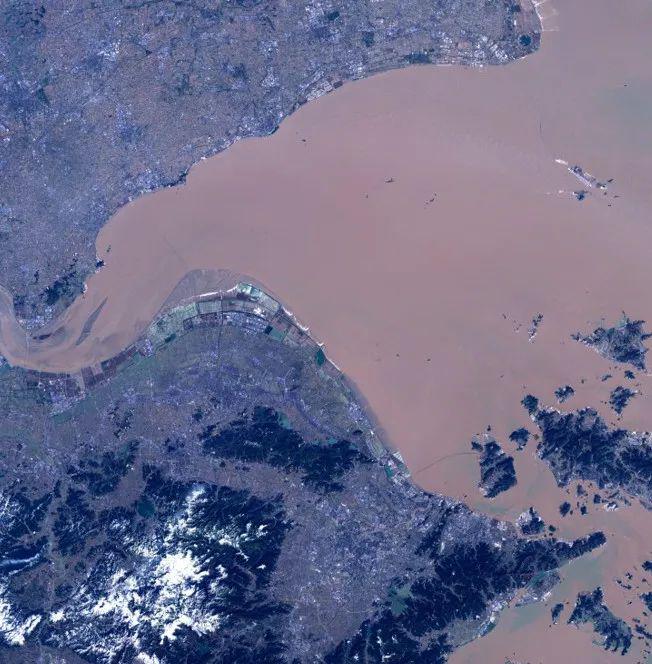
The above picture of Hangzhou Bay uses 753. If the band combination is 432, the effect is shown below. The true color picture synthesized in 432 band is close to the true color of the ground object, the image is insipid and the tone is dark.
2.Process
l8path = r'pathOfLandsat8\LC08_L1TP_118039_20160126_20170330_01_T1'
fileName = l8path.split("\")[-1]
prefix = os.path.join(l8path,fileName)
bands = ['B1', 'B2', 'B3', 'B4', 'B5', 'B6', 'B7', 'B10', 'B11']
n_bands = len(bands)
temp = tiff.imread(prefix + "_B1.TIF")
arr = np.zeros((n_bands, np.shape(temp)[0], np.shape(temp)[1]), dtype=np.float)
for i in range(n_bands):
    file2read = prefix + "_" + bands[i] + ".TIF"
    arr[i, :, :] = tiff.imread(file2read)
Select three bands:
The lower bound of rgb= (6,4,2) # Python is 0, but it is actually 753
rgb_bands = arr[rgb, :, :]
rgb_bands = _stretch_im(rgb_bands, 2)
rgb_bands = bytescale(rgb_bands).transpose([1, 2, 0])
plt.close('all')
fig, ax = plt.subplots(figsize=figSize)
ax.imshow(rgb_bands, extent=extent)
ax.set_title(title)
ax.set(xticks=[], yticks=[])
Two functions are used, one of which is to improve the contrast of the image, and the other normalizes the band data to the [0255] interval commonly used by pixels.
def _stretch_im(arr, str_clip):
  s_min = str_clip
  s_max = 100 - str_clip
  arr_rescaled = np.zeros_like(arr)
  pLow, pHigh = np.percentile(arr[arr > 0], (s_min, s_max))
  arr_rescaled = exposure.rescale_intensity(arr, in_range=(pLow, pHigh))
  return arr_rescaled.copy()
def bytescale(data, high=255, low=0, cmin=None, cmax=None):
  if data.dtype == "uint8":
    return data
  if high > 255:
    raise ValueError("high should be less than or equal to 255.")
  if low < 0:
    raise ValueError("low should be greater than or equal to 0.")
  if high < low:
    raise ValueError("high should be greater than or equal to low.")
  if cmin is None or (cmin < data.min()):
    cmin = float(data.min())
  if (cmax is None) or (cmax > data.max()):
    cmax = float(data.max())
  # Calculate range of values
  crange = cmax - cmin
  if crange < 0:
    raise ValueError("cmax should be larger than cmin.")
  elif crange == 0:
    raise ValueError(
      "cmax and cmin should not be the same value. Please specify "
      "cmax > cmin"
    )
  scale = float(high - low) / crange
  # If cmax is less than the data max, then this scale parameter will create
  # data > 1.0. clip the data to cmax first.
  data[data > cmax] = cmax
  bytedata = (data - cmin) * scale + low
  return (bytedata.clip(low, high) + 0.5).astype("uint8")
3.Summary
This remote sensing image can not only be used as the base map of our map, but also realize the fusion of two remote sensing images and overlay the data we want to overlay on the image.