GIS application techniques: data structure (grid and vector)
GIS application techniques: data structure (grid and vector)
1.Data structure
Data structure refers to the form of data organization, which is a data logical structure suitable for computer storage, management and processing. Spatial data is an abstract description of the spatial arrangement and relationship of geographical entities. It is a kind of understanding and interpretation of data. Data without data structure is useless. Not only users cannot understand it, but also computer programs cannot correctly process it. For the same group of data, processing according to different data structures may result in different contents. Spatial data structure is a bridge for GIS to communicate information. Only by fully understanding the specific data structure adopted by GIS, can the system be used correctly and effectively. The spatial data structure of GIS mainly includes vector structure and grid structure.
(1) Grid data structure
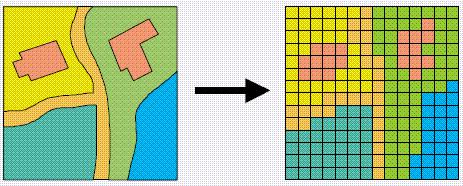
Grid structure is the simplest and most intuitive spatial data structure, also known as Raster or Gridcell or pixel structure. It refers to dividing the earth's surface into grid arrays with uniform size and close proximity. Each grid is defined as a pixel or pixel by row and column numbers, and contains a code that represents the attribute type or magnitude of the pixel, or only contains a pointer to its attribute record. Therefore, the grid structure is a data organization that represents the distribution of spatial features or phenomena in a regular array, and each data in the organization represents the non-geometric attribute features of the features or phenomena. As shown in the figure, in the grid structure, points are represented by a grid cell; Linear figures are represented by a group of adjacent grid cells along the line, and each grid cell can only have two adjacent cells on the line at most; A face or area is represented by a collection of adjacent grid cells with area attributes. Each grid cell can have more than two adjacent cells belonging to the same area. Any object distributed in areal form (land use, soil type, terrain fluctuation, environmental pollution, etc.) can be represented by grid data. Remote sensing image is a typical grid structure, and the number of each pixel represents the gray level of the image.
(2) Vector data structure
Vector data is a structure-oriented structure, that is, each specific target is directly assigned with location and attribute information as well as the description of the topological relationship between the targets. The data structure based on vector model is called vector data structure for short. A vector is also called a vector, which is mathematically called a "quantity with size and direction". In computer graphics, the length of the arc segment between two adjacent nodes represents the size, and the sequence of the two ends of the arc segment represents the direction, so the arc segment is also an intuitive vector. Vector data structure is a data organization method that represents the spatial distribution of geographical entities such as points, lines, and surfaces by recording coordinates. This data organization method has obvious positioning, implicit attributes, and can best approximate the spatial distribution characteristics of geographical entities. The data accuracy is high, and the redundancy of data storage is low. It is convenient for network analysis of geographical entities, but it is difficult to analyze the superposition of multi-layer spatial data. The acquisition methods of vector data structure mainly include: manual digitization, hand tracking digitization, and data structure conversion.
(3) Comparison of two data structures
Grid structure and vector structure are two different methods to simulate geographic information. The raster data structure type has the characteristics of "obvious attributes and implicit positions", which is easy to implement and easy to operate, and is conducive to the analysis of the spatial information model based on the grid. For example, if the polygon area and line density are calculated in a given area, the grid structure can be calculated quickly, while the vector data structure is much more troublesome; However, the accuracy of raster data expression is not high, the amount of data storage is large, and the work efficiency is low. If we want to double the expression accuracy (reduce the grid unit by half), we need to increase the data volume by three times, and also increase the data redundancy. Therefore, for applications based on grid data structure, it is necessary to properly balance the relationship between grid data expression accuracy and work efficiency according to the characteristics of the application project and its accuracy requirements. In addition, because of the simplicity of raster data format (without compression coding), its data format is easily understood by most programmers and users, and information sharing based on raster data is also easier than vector data. Finally, the remote sensing image itself is a grid structure based on pixels. Therefore, the remote sensing image can be directly applied to the geographic information system with grid structure, that is to say, the grid data structure is easier to combine with remote sensing. The type of vector data structure has the characteristics of "obvious position and implicit attribute", which is relatively complex to operate. Many analysis operations (such as overlay analysis) are difficult to implement with vector data structure; However, its data expression accuracy is high, data storage is small, output graphics are beautiful and work efficiency is high. The comparison between the two is shown in the table below.
<center> <table height="200" border="1" cellpadding="0" cellspacing="0"> <tbody> <td><div align="center"><strong>Compare content</strong></div></td> <td><div align="center"><strong>Vector format</strong></div></td> <td><div align="center"><strong>Grid format</strong></div></td> </tr> <tr> <td><div align="center" >Data volume</div></td> <td><div align="center" >Small</div></td> <td><div align="center" >Large</div></td> </tr> <tr> <td><div align="center" >Graphic accuracy</div></td> <td><div align="center" >High</div></td> <td><div align="center" >Low</div></td> </tr> <tr> <td><div align="center" >Graphic operation</div></td> <td><div align="center" >Complex and efficient</div></td> <td><div align="center" >Simple and inefficient</div></td> </tr> <tr> <td><div align="center" >Remote sensing image format</div></td> <td><div align="center" >Inconformity</div></td> <td><div align="center" >Consistent or close</div></td> </tr> <tr> <td><div align="center" >Output representation</div></td> <td><div align="center" >Abstract and expensive</div></td> <td><div align="center" >Intuitive and cheap</div></td> </tr> <tr> <td><div align="center" >Data sharing</div></td> <td><div align="center" >Not easy to realize</div></td> <td><div align="center" >Easy to implement</div></td> </tr> <tr> <td><div align="center" >Topology and network analysis</div></td> <td><div align="center" >Easy to implement</div></td> <td><div align="center" >Not easy to realize</div></td> </tr> </table> </body> <html> </center>
2.Common data
(1) Map data
The map is the main data source of GIS, because the map contains rich content, including not only the categories and attributes of entities, but also the spatial relationship between entities. Map data is mainly obtained through tracking and scanning digitization of maps. Map data can be used not only for macro analysis (using small-scale map data), but also for micro analysis (using large-scale map data). When using map data, the deformation caused by map projection should be taken into account, and projection transformation should be carried out when necessary, or geographic coordinates should be converted. Map data usually uses points, lines, areas and notes to represent the relationship between geographical entities and entities, such as: points-residential areas, sampling points, enterprises, central cities, etc; Lines - rivers, roads, structural lines, etc; Surface - county, city, province, etc; Notes - place name notes, elevation notes, etc. Map data is mainly used to generate DLG, DRG data or DEM data.
(2) Remote sensing image data, which is an important data source of GIS
Remote sensing image data contains rich resources and environmental information. With the support of GIS, it can be combined and comprehensively analyzed with information from geology, geophysics, geochemistry, geobiology and military applications. Remote sensing image data is a large area, dynamic, near real-time data source, and remote sensing technology is an important means of GIS data update. Remote sensing image data is used to extract gray values, line data and generate digital orthophoto data, DEM data, etc.
(3) Text materials
Text data refer to relevant legal documents, industrial norms, technical standards, provisions and regulations of various industries and departments, such as government work reports. These are also GIS data.
(4) Statistics
Many government departments and institutions have a large amount of statistical data in different fields (such as population, transportation, science and technology, etc.), such as relevant statistical yearbooks, statistical bulletins, etc., which are important sources of GIS data, especially GIS attribute data.
(5) Measured data
The data obtained from field survey and field survey can be directly entered into the geographic database of GIS through conversion to facilitate real-time analysis and further application. The data obtained by GPS (Global Positioning System) is also an important data source of GIS.
(6) Multimedia data
Multimedia data (including voice, video, etc.) can usually be transferred into GIS geographic database through communication port. At present, its main function is to assist GIS analysis and query.
(7) Data GIS of existing systems can also obtain corresponding data from other information systems and databases that have been built.
Due to the promotion of standardization and standardization, data sharing and interchangeability between different systems are becoming stronger and stronger. This expands the availability of data and increases the potential value of data.
(8) Internet data
With the continuous deepening of the Internet, the data can also be obtained in the form of websites. The data acquisition cost is low and the timeliness is good. For example, a large amount of vector data can be obtained through the official website of the National Geographic Information Resource Directory Service website: http://www.webmap.cn/main.do?method=index. Its data content includes ten or two kinds of element layers, including administrative district (area), administrative boundary point (base point of territorial sea), administrative boundary (line), water system (point, line, area), highway, railway (point, line), residential area (point, area), residential area (note point), natural place name (note point), etc. Enter the website and select [Data Download] - [1:100000 National Basic Geographic Database] to query and download.
3.Software operation of data structure transformation
In GIS, raster data and vector data have their own characteristics and applicability. In order to be compatible with these two types of data in a system and facilitate further analysis and processing, it is often necessary to realize the conversion of the two structures.
(1).Conversion from raster data to vector data
The purpose of raster to vector conversion processing is to output the results of raster data analysis through the vector drawing device, or to convert a large amount of areal raster data into polygon boundaries represented by a small amount of data for the purpose of data compression, but the main purpose is to add the raster data obtained by the automatic scanner to the vector database. The raster data can be converted into three different types of vector data, including point-like, line-like and area-like vector data. The conversion of raster data to areal vector data is taken as an example for illustration. The other two conversion operations are similar, but will not be explained here.
Expand the Conversion Tool toolbox, open the Convert to Grid tool set, double-click Convert to Grid, and open the corresponding dialog box in Chapter 4 Spatial Data Base and Processing.
Select the grid data to be converted in the [Input Grid] text box.
Type the path and name of the output areal vector data in the [Output Face Feature] text box.
Select the [Simplify Face] button (the default state is Select) to simplify the boundary shape of areal vector data. If you want to retain grid information to a higher accuracy, you can leave this button unchecked.
Click OK to perform the conversion operation.
(2).Conversion from vector data to raster data
Many data, such as administrative boundaries, traffic axes, urban land use types, are input into the computer by vector digitization or stored in the computer by vector, and are represented as point, line and polygon data. However, the processing of vector data directly used for composite analysis of multiple data will be more complex, especially different data need to be matched one by one on the location, find the intersection point and analyze. By contrast, it is much easier to use grid data mode for processing.
In addition, data such as land cover and land use are often obtained from remote sensing images. These data are raster data. Therefore, vector data and their superimposed composite analysis need to transform them from the form of vector data to the form of raster data. The basic coordinates of vector data are rectangular coordinates X and Y, and the coordinate origin is generally taken from the lower left corner of the graph. The basic coordinates of grid data are rows and columns (i, j), whose coordinate origin is generally taken from the upper left corner of the graph. When two kinds of data are transformed, make the rectangular coordinates X and Y parallel to the row and column respectively. Because the basic elements of vector data are points, lines, and faces, so as long as the conversion of points, lines, and faces is realized, the transformation of various line drawings can be basically solved.
Expand the Conversion Tool toolbox, open the Convert to Grid tool set, and double-click Feature to Grid to open the Feature to Grid dialog box.
Select the vector data to be converted in the Input Element text box.
Select the attribute value to be used for data conversion in the Field window.
Type the path and name of the output grid data in the Output Grid text box.
Type the output grid size in the [Output pixel size] text box, or browse to select a grid data, and the output grid size will be the same.
Click OK to perform the conversion operation. This command also applies to feature classes in geographic databases.