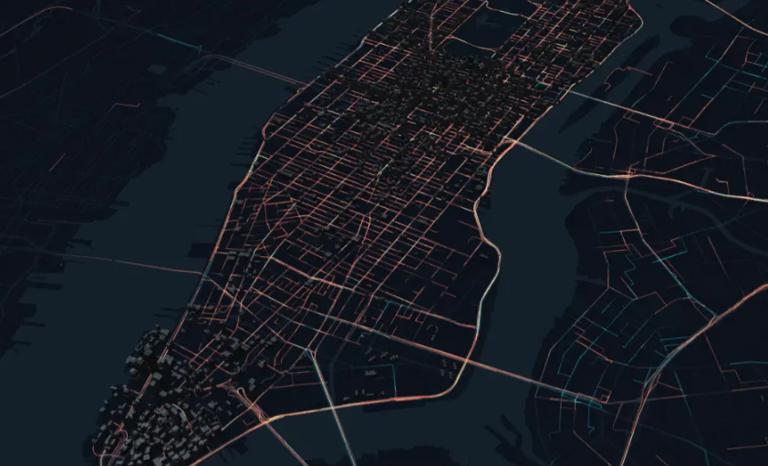
3D GIS application development - a practice based on Mapbox GL
In the recent web visualization project, Mapbox is an artifact of map development due to the needs of related businesses.
Let's introduce the front-end GIS engine Mapbox GL JS of Mapbox step by step from this project.
1. Simple understanding
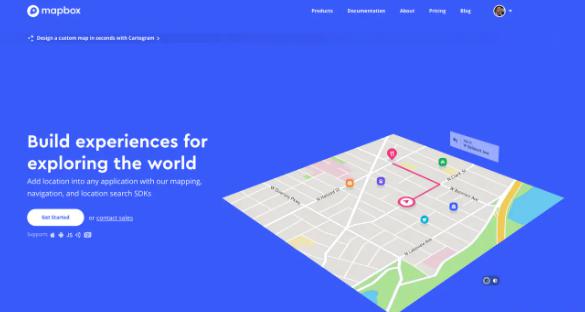
First of all, Mapbox is a very Newbee company in the mapping space. Customized online maps have been provided for websites of Foursquare, Pinterest, Evernote, Financial Times, The Weather Channel, Uber Technology, and more. Since 2010, the company has rapidly expanded its market position in custom maps in response to the limited choice offered by map vendors such as Google Maps. Mapbox is the creator or largest contributor to some of the open source map libraries and applications, including the MBTiles specification, the TileMill mapping IDE, the Leaflet JavaScript library, and the CartoCSS map formatting language and parser. The company's data is sourced from both open and proprietary sources, such as Open Street Map (OSM) and NASA, and proprietary data sources include DigitalGlobe. Its technology is based on Node.js, CouchDB, Mapnik, GDAL and Leafletj.
Mapbox has developed GIS engines for different platforms to meet the needs of developers or related users. Such as iOS SDK (for iOS-side development), Android SDK (for Andriod-side development), Navigation SDK (for Navigation side development), Unity SDK (for Unity side development), GL JS (for web-side development). In addition to the different ways of using SDK on different platforms, the functional features are also more or less different. In addition, Uber has developed react-map-gl for react. Overall, Mapbox's open source technology stack is very comprehensive.
2. Easy to use
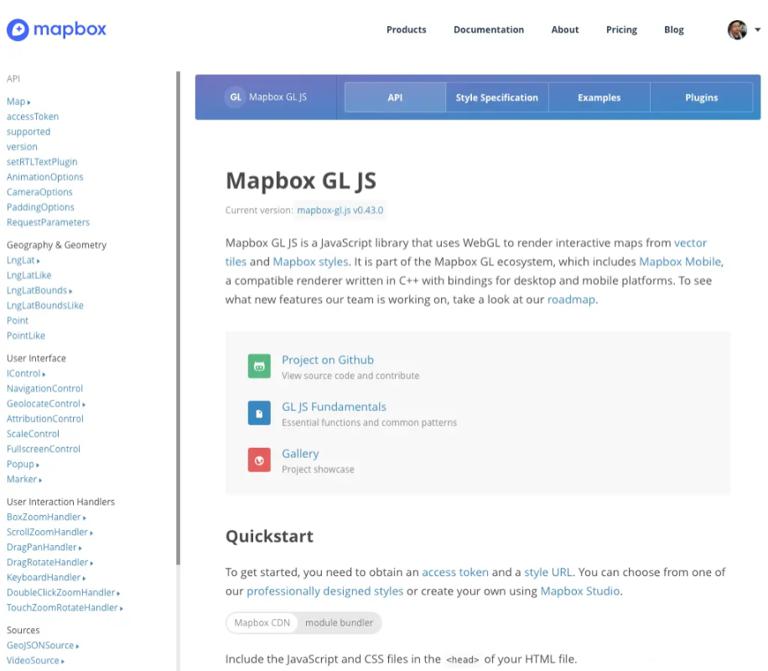
The mapbox-gl documentation consists of four parts: API, Style Specification, Example, and Plugins. As the name suggests, an API is a specification of all interfaces (methods) provided to users by a general framework (class library); Style Specification is a style specification for Mapbox maps; Examples are code examples for some common functions or common businesses, covering most of the functional effects that can be achieved with Mapbox; Plugins is officially recommended for some plug-ins and open source projects that can be used with mapbox-gl, such as some third-party UI controls, display plugins, framework integration tools, development assistance tools, utility libraries, etc. For children's shoes that are new to Mapbox, it is recommended to start with the example on the official website, so that you can quickly master the use of mapbox-gl and put it into development practice.
3. Rapid practice
The following is based on the project shown at the beginning of the article, and introduces its actual combat steps.
Load the map:
So I'm using mapboxgl You need to configure the user first. token (you can get it by registering on the official website of Mapbox).
Import mapboxgl from 'mapbox-gl'
Mapboxgl.accessToken ='< Your Token Here >'
Next, use to create a map instance. The main configuration items are as follows:
Const myMap = new mapboxgl.Map ({
Container:'< Id of Container Element >'
Style:'< Your Style Here >'
Center: [112.508203125, 37.97980872872457]
Zoom: 4
Pitch: 0
Bearing: 0
});
Among them, container is the element ID of the map container, style is the URL of the map style, or your own defined style (subject to the Mapbox style specification), and center is the default center point position after the map is loaded to locate the position of the map when it is loaded. Zoom pitch bearing refers to the zoom level, ground normal offset angle, ground axis offset angle, etc., respectively, to determine the map area and spatial relationship displayed in the current viewport. The meaning of the configuration items can be found in the official website documentation.
Draw graphics
This paper mainly introduces how the 3D architecture and flying line animation in the video are realized, here is a related code snippet to introduce the practical approach.
When drawing graphics in Mapbox, layer and source are the most important concepts. The latter is used to store the data content of graphics, while the former is the representation (layer) of graphics in 3D scenes. In Mapbox, once a layer is created, the data source (i.e. source) with the same name (ID) must also be created. On the contrary, you can also create a layer after creating the source to use the created data source. At this time, the data source and the layer do not need to have the same name. The second way is to change data to drive graphic changes:
// create a data source with id as buildings
MyMap.addSource ('buildings', {
Type: 'geojson'
Data:'< GeoJson Contents >'
});

// use the data of buildings to draw a graph with id as building_layer
MyMap.addLayer ({
Id: 'building_layer'
Type: 'fill-extrusion'
Source: 'buildings'
... < Other Options >
});
Based on the above method, when the data changes, we only need to reset the data of the data source to drive the layer redrawing:
If (myMap.getLayer ('building_layer')) {
MyMap.getSource ('buildings'). SetData (< New GeoJson Contents >)
}
As for the specific implementation of 3D effects and animation, here are two examples on the official website, which I believe you can see at a glance:
Graphic interaction
The interaction method provided by Mapbox is relatively flexible, and a variety of cool and practical interaction effects can be achieved by learning and using API documents. For example: use myMap.on('zoom', callback) You can bind a drawing to the zoom of a map When the zoom factor is less than a certain value, you can hide some graphic elements:
MyMap.on ('zoom', ()) = > {
If (myMap.getZoom () < = 4) {
MyMap.setLayoutProperty ('building_layer',' visibility', 'none')
} else {
MyMap.setLayoutProperty ('building_layer',' visibility', 'visible')
}
});
Or, for example, continuous calls myMap.flyTo() to make the view move slowly along a certain trajectory on the map. It can give users a simulated flight experience. This is how the automatic inspection in the video is achieved.
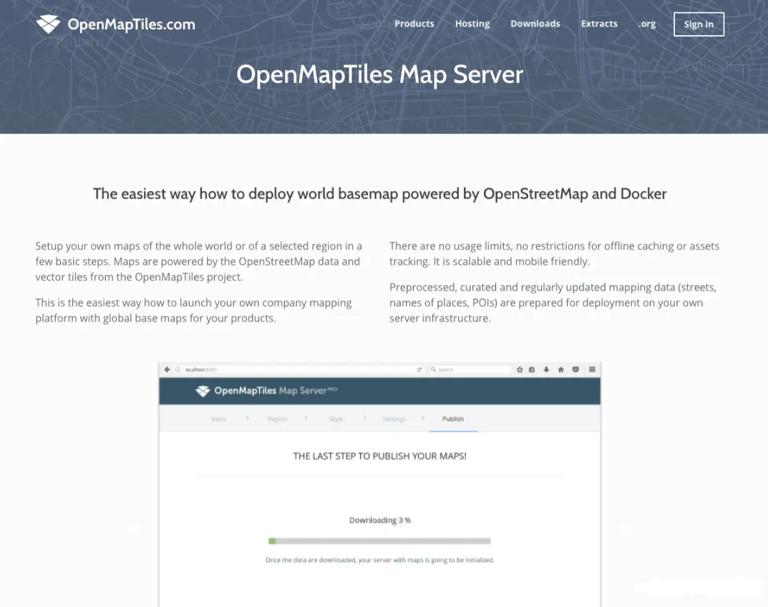
Localization of tiles-server
Because Mapbox mapping services use MBTiles to store data, many mapping services have accepted this set of standards, (e. G. OSM,Open Street Map). So you can build your own tiles-server to replace the online mapping service that uses Mapbox directly.
The benefits of this are obvious: first, the access speed of the data interface can be improved by means of load balancing. Effectively improve the loading speed of data; first, to ensure that applications can still be effectively deployed and used in a zero-bandwidth environment.
The wall is cracked here. Amway has an open source docker image: openmaptiles-server. It can be downloaded from its website and dockerhub. Personally, I think its biggest bright spot is that even if you don't understand the internal implementation. It does not affect its use.
The docker command to run the tiles-server service is as follows:
$docker run-- rm-it-v $(pwd): / data-p 8080 purl 80
Then all that needs to be done is to open its navigation page http://localhost:8080/ (the port number depends on your startup command). Then follow the prompts on the page to set up step by step (after the last step, you will download the map from OSM, so at first you don't have to worry about where the data is coming from.), it's a completely stupid deployment.
4. Performance tuning
In the process of Mapbox GL practice, some factors that affect the overall performance of the application are found. Therefore, I would like to make a statement here to provide some experience for children's shoes to fill the hole later:
(1).When using geo data (such as GeoJson format data) to define a drawing If the amount of data is too large, it will slow down the speed of data loading. Consider:
- i. Compress and decompress the data reasonably before and after the http request in order to save the amount of data transmitted by the http request as much as possible.
- ii. When conditions permit, a group of data can be loaded in pieces, exchanging space for time.
(2).Do not draw too many layers in Mapboox First, it is not easy to manage (of course, there are many third-party tools for managing Mapbox layers on github) First, too many layers will significantly reduce the rendering and response performance of GL. So before drawing the graph, You can first consider the division of layers to achieve as many effects as possible with the least number of layers.
(3).When the data volume is the same, use mapboxgl Marker is not as good as the layer whose type is symbol. The reason is that the tags generated by the former are DOM elements. If you can imagine the result of operating hundreds of DOM nodes in a web page at the same time, you may understand my suggestion.
5. Summary
Finally, I summarize some personal feelings about Mapbox. Mapbox's product positioning is GIS (cross-platform, application) anytime, anywhere. It provides us with a series of API with simple operation, which makes GIS development flexible and interesting. Especially for developing GIS-type data visualization applications, Mapbox is an excellent choice.
However, if you are only for those gorgeous 3D effects, it may be more appropriate to choose a special framework.