Vector Data Structure #
Definition #
Another common graphic data structure in Geographic Information System is vector structure, that is to say, geographic entities such as points, lines and polygons are represented as accurately as possible by recording coordinates. The coordinate space is set as continuous, allowing precise definitions of arbitrary positions, lengths and areas. In fact, its accuracy is only limited by the accuracy of digital equipment and the length of digital records. In this case, the accuracy is much higher than that of the grid structure.
For point entities, only their coordinates and attribute codes are recorded in the vector structure. For line entities, the digitizination is the quantization. A curve is represented by a series of sufficiently short straight lines joined at the beginning and ending. When the curve is divided into many and short line segments, these small line segments can be approximated as straight line segments, and the curve can also be accurately divided by a series of lines. These small line segment sequences represent that only the coordinates of the endpoints of these segments are recorded in the vector structure, and the curves are represented as a coordinate sequence. The coordinates are considered to be connected by line segments, which can vividly represent the linear objects of various shapes within a certain precision range. Polygon is a spatial area with arbitrary shape and completely closed boundary in the geographic information system. Its boundary divides the whole space into two parts: the part containing the infinite point is called the exterior, and the other part is called the interior of the polygon. A closed area is called a polygon because the boundary line of the area, like the line entity introduced earlier, can be regarded as a series of multiple and short line segments, each small line segment as a side of the area, so this area can be regarded as a polygon composed of these edges.
Tracking digitizer generates vector structure digital map for map digitization, which is suitable for vector plotter drawing. Vector structure allows the most complex data to be stored with minimal data redundancy. Compared with raster structure, data has high accuracy and occupies less space. It is an efficient spatial data structure.
Characteristic #
The characteristics of vector structure are obvious location and implicit attributes, which are stored directly according to coordinates, while attributes are generally stored in some specific locations in the file header or data structure. This feature makes the algorithm of graphics operation more complex than raster data structure on the whole, and some are even difficult to implement. Of course, some places are also convenient and unique. In the operations of length, area, shape, graph editing and geometric transformation, the vector structure has high efficiency and accuracy, while in the operations of superposition and neighborhood search, it is more difficult.
Coding method #
Point entity #
Vector coding of point and line entities is relatively direct, as long as the spatial information and attribute information can be recorded completely. Points are geographic entities that can no longer be separated in space. They can be concrete or abstract, such as terrain points, text location points or nodes of line segment networks, etc. They are represented by a pair of X and Y coordinates. Figure 7-8-a shows the basic content of point vector coding.
Line entity #
Line entities are mainly used to represent symbolic lines and polygonal boundaries of linear objects (such as highways, river systems, ridges, etc.), sometimes also known as “arcs”, “chains” and “strings”. Their vector coding generally includes the following contents. Figure 7-8-b is the basic content of vector coding of line entities.
Among them, the unique identification code is the system permutation serial number. The line identification code can identify the type of line, and the starting and ending point numbers can be directly expressed in coordinates. The display information is the text or symbol when displayed, and the non-geometric attributes associated with the line can be directly stored in the line file, or can be stored separately, and searched by the identification code. Fig. 95 The encoding of point entities and the encoding of line entities # 
Polygon #
Polygon data is the most important type of data to describe geographic information. In regional entities, those with name attributes and classification attributes are usually represented by polygons, such as administrative areas, land types, vegetation distribution, etc., those with scalar attributes are sometimes described by contours (such as topography, rainfall, etc.).
Polygon vector coding not only expresses location and attributes, but also expresses the topological properties of regions, such as shape, neighborhood and hierarchy, so that these basic spatial units can be displayed and manipulated as thematic map data. Because of the abundant information to be expressed and the complex operation based on polygon, polygon vector coding is more efficient than point and line-based coding, volume vector coding is much more complex and important.
In addition to the requirement of storage efficiency, polygon vector coding generally requires that the polygons represented have their own independent shapes, and can calculate their perimeters and areas, and other geometric indicators. The recording methods of the topological relationships of polygons should be consistent in order to carry out spatial analysis. The hierarchy of regions, such as the island-lake-island relationship, should be clearly expressed. Therefore, it is quite different from the coding designed by computer-aided cartography system for display and cartography purposes.
1) Coordinate Sequence Method (Spaghetti Method) Fig. 96 Polygons represented by coordinate sequence method # 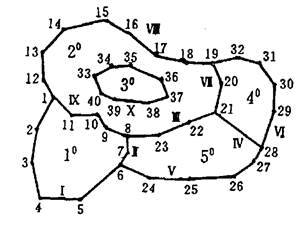
The simplest polygon vector coding is composed of X and Y coordinate pairs of polygon boundary and description information. Fig. 7-9 shows the following coordinate files:
1⁰: x₁,y₁; x₂,y₂; x₃,y₃; x₄,y₄; x₅,y₅; x₆,y₆; x₇,y₇; x₈,y₈; x₉,y₉; x₁₀,y₁₀; x₁₁,y₁₁
2 0 :x 1 ,y 1 ;x 12 ,y 12 ;x 13 ,y 13 ;x 14 ,y 14 ;x 15 ,y 15 ;x 16 ,y 16 ;x 17 ,y 17 ;x 18 ,y 18 ;x 19 ,y 19 ;x 20 ,y 20 ;x 21 ,y 21 ;x 22 ,y 22 ;x 23 ,y 23 ;x 8 ,y 8 ;x 9 ,y 9 ;x 10 ,y 10 ;x 11 ,y 11 ;
3 0 :x 33 ,y 33 ;x 34 ,y 34 ;x 35 ,y 35 ;x 36 ,y 36 ;x 37 ,y 37 ;x 38 ,y 38 ;x 39 ,y 39 ;x 40 ,y 40 ;
4 0 :x 19 ,y 19 ;x 20 ,y 20 ;x 21 ,y 21 ;x 28 ,y 28 ;x 29 ,y 29 ;x 30 ,y 30 ;x 31 ,y 31 ;x 32 ,y 32 ;
5 0 :x 21 ,y 21 ;x 22 ,y 22 ;x 23 ,y 23 ;x 8 ,y 8 ;x 7 ,y 7 ;x 6 ,y 6 ;x 24 ,y 24 ;x 25 ,y 25 ;x 26 ,y 26 ;x 27 ,y 27 ;x 28 ,y 28 ;
The file structure of coordinate sequence method is simple, and it is easy to realize the operation and display of polygon. The disadvantages of this method are:
The common boundaries between polygons are digitized and stored twice, leading to redundant and sliver polygons;
Each polygon has its own system and lacks neighborhood information, which makes it difficult to process neighborhood, such as eliminating the common boundary between two polygons;
The island is constructed as a single figure without any connection with the outsourcing polygon;
It is not easy to check for topological errors. This method can be used in simple rough precision mapping system.
2) Tree Index Coding
The method uses tree index to reduce data redundancy and indirectly increase neighborhood information. The method digitizes all boundary points, stores coordinate pairs in order, connects point index with boundary line number, leads each polygon by clues, and forms tree index structure.
Figures 7-10 and 7-11 are respectively polygonal and line file tree index sketches of Figure 7-9. Its document structure is as follows: Fig. 97 Tree index between lines and polygons # Fig. 98 Tree index between points and boundary lines # 

Using the above tree structure, the polygon data of Figure 7-9 are recorded as follows:
Point file
Order number | Coordinate | ||||||||||||||||||||||||||||||||
1 | x:sub:`1`,y:sub:`1` | ||||||||||||||||||||||||||||||||
2 | x:sub:`2`,y:sub:`2` | ||||||||||||||||||||||||||||||||
… | … | ||||||||||||||||||||||||||||||||
40 | x:sub:`40`,y:sub:`40` Line file
|