Interface design principle #
In the design stage, in addition to the design algorithm, data structure and other contents, a very important part is the design of the system interface, which is the interface of human-computer interaction, including how to command the system and how to submit information to the user. A well-designed user interface makes it easier for users to master the system, thus increasing users’ acceptance of the system. In addition, the system user interface directly affects the user’s mood when using the system, and the following situations will undoubtedly make the user feel bored and at a loss:
The gaudy interface makes it difficult for users to understand its specific meaning and don’t know where to start;
An ambiguous hint
A long reaction (more than ten seconds)
Extra operation (the user intended to do only this, but the system did something else in addition to this).
On the contrary, a successful user interface must be user-centered, integrated and interactive.
Although graphical user interface (GUI,Graphical User Interface) has been widely used and supported by many interface design tools, due to the above reasons, interface design should be placed in a very important position in the process of system development.
The strategy for designing a user interface consists of the following [Peter Coad,Edward Yourdon] :
Classification of people: by carefully studying the people who use the system, classifying them, including according to the level of skills (beginners, senior personnel … ), according to the organizational level (managers, general employees … ), according to the identity (staff, customers … ). Through classification, we can find out the purpose of each type of personnel using the system, and then we can determine its corresponding human-computer interaction.
Describe people and their task scripts: after classifying people, identify the characteristics of each category of people, including the purpose of using the system, characteristics (age, education level, limitations, etc.), expectations of the system (must / want, like / dislike / biased), proficiency, use of the system’s task script (scenario). According to these characteristics, we can guide the human-computer interaction design of the system.
Design command layer: the design of the command layer includes three aspects of work, namely, studying the moral and criteria of the existing user interaction; establishing an initialization command layer; and refining the command layer. In the design process of graphical user interface, some formal or informal guidelines and meanings have been formed, such as menu arrangement (for example, in almost all MS-Windows applications, the first three first-level menu items are always “file”, “edit” and “view”, while the last two are “window” and “help”), and some operations (for example, Open files, save files, print) graphical metaphors, and so on. Follow these guidelines to facilitate users to familiarize themselves with the system more quickly. When refining the command layer, we need to consider the arrangement, the whole-part combination, the comparison of width and depth, the minimum operation steps and so on. One level of too “deep” command items will make it difficult for users to find, while too many command items will make it difficult for users to master.
Design detailed interaction: there are several guidelines for the design of human-computer interaction, including:
Consistency : Use consistent terminology, consistent steps, and consistent activities;
Less operational steps : Minimize the number of keystrokes and mouse clicks;
Don’t play the video silently : The long-term operation needs to tell the user the progress;
Closure : With a few small steps to lead to well-defined activities, users should feel the meaning of closures in their activities;
Undo : People are bound to do something wrong, and usually in this case the system should support restitution, or at least partial support.
Reduce the memory burden on the human brain : People should not be required to remember or write down some information from one window and then use it in another window;
Time and effectiveness of learning : Provide online reference information for more advanced features;
Fun and Attraction : People usually like to use software that is interesting.
Continue making prototypes : By doing the prototype system, we can directly understand the user’s reaction to the design interface, and then improve it to make it perfect.
Design user interface classes : After completing the above work, you can begin to design the user interface class. When developing GUI programs, you usually already provide a series of general interface classes, such as windows, buttons, menus, and so on, from which specific subclasses can be derived.
Design based on graphical user interface : At present, the main GUI includes Windows,Macintosh,X-Windows,Motif, based on which the development of application software can simplify the design of the interface, but its characteristics should be known in advance, such as event handling and so on.
Elements in GIS Interface Design #
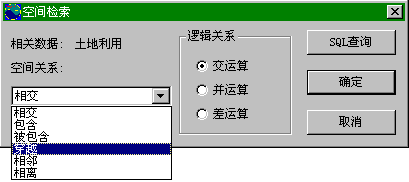
For successful GIS software, a good interface is indispensable, in the design, we should also follow the above principles and steps. For GIS software, its interface needs to allow users to select and retrieve the corresponding spatial data, manipulate the data, and represent the results of the analysis. For basic data retrieval, operation and performance, which is consistent with ordinary software, the following elements should be considered in GIS: The filter used to select data may include spatial and non-spatial attributes, or a combination of both, for example (for a county administrative division data): Retrieve all counties with a population greater than 100000; Retrieve all the counties through which railways pass; Retrieve all counties with railways and a population of more than 100000; Users can enter a command statement, select from a menu, fill out a form, or select data through direct actions, such as using a mouse. Using command statements requires understanding the structure of the data table and extending the traditional SQL to support spatial filtering. Direct operation selection requires data to be displayed on the screen, and the combination of it and SQL queries is usually done indirectly. When some figures are displayed in a similar position, the direct operation selection will be ambiguous. In order to facilitate users to operate, it is necessary to provide some additional operations, such as roaming, magnifying display, zooming out display and so on. A good form of data representation is beneficial for users to operate directly for further analysis. compared with the standard relational database, more consideration should be given to its graphic display in GIS. The similarities or differences in graphic performance can be expressed to the user that these figure objects have some degree of similarity. Some variables shown in the graphics are: Polygon outline: color, grayscale, black and white; linetype; Polygon fill: color, grayscale, black and white; fill mode; Lines: color, grayscale, black and white; linetype; Symbols: color, grayscale, black and white; shape; size, etc. For graphic display, it needs to be carefully designed to correctly express the meaning of figure objects and be understood by users. Data processing consists of a series of spatial and non-spatial operations, and a well-designed interface makes it easier to implement these operations. Compared with the standard relational database, the data managed by GIS has more object-oriented characteristics, so an object-oriented interface is conducive to the interaction between users and the system to complete data processing. In GIS software, object-oriented interface design includes the representation of geographic entities, such as points, lines, polygons and some operations as pictographic symbols, and users can achieve the corresponding data processing through simple click, drag and drop and other operations. Some operations with graphical implications are listed below, and it is easy to associate the graphical representation with the corresponding operations. Create: creates a spatial object based on a given graphical entity and corresponding attributes; Delete: delete a selected space object; Collection: forms a collection based on selected objects; Update: displays only the results of the last operation; Superposition: equivalent to a union operation in a collection operation; Intersection: equivalent to an intersection operation in a set operation; Difference: equivalent to a difference operation in a set operation; Conversion: scale, move, mirror, affine transformation and other operations on the selected figure; Checkpoint: set a checkpoint to which you can fall back when you are not satisfied with your later work; Echo: returns the status of the previous checkpoint; Submit: send all processing results to the database and update them. Traditional SQL can not handle spatial query, which is due to the weakness of relational database technology. For GIS, it is necessary to extend SQL. SQL/MM, which is currently being developed, is mainly used in multimedia data, which contains a comprehensive set of GIS operations. The adoption of the new SQL standard has brought about a change in concept. For traditional SQL, to achieve spatial operations, it is necessary to embed SQL commands into a programming language, such as C, while the new SQL allows users to define their own operations and embed them into SQL commands. This extended SQL actually adds object-oriented support. In GIS, it is called GeoSQL,GeoSQL, which can be written as follows: SELECT Soils.Map From Soils,Parcels Where Parcels.Value>6000 and Overlay(Soils,Parcels); The network query command As it is still quite difficult to fully implement GeoSQL, the current implementation idea of most GIS software is to input standard SQL query statements and spatial queries respectively (figure 16-14), then deal with them separately, and finally merge the results, which is not flexible enough. Fig. 250 An interface that implements spatial queries, entering spatial relationships and standard SQL separately # Because GIS is based on graphics, the results of its analysis and interpretation are usually shown in the form of visualization. Visualization refers to the process of generally expressing information in order to identify, communicate and explain patterns or structures. Spatial analysis needs to consider the perception of information patterns and spatial characteristics. For GIS, visualization can be described as a process of transformation from information to knowledge. For GIS, in addition to representing all kinds of information in a visual form, realizing the expression of WYSIWYS (What You See Is What You Get) is also an important principle of interface design.Data selection #
Data performance #
Data processing #
SQL #
Visualization #
GIS interface style #
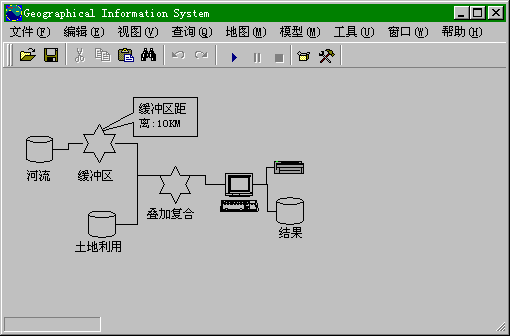
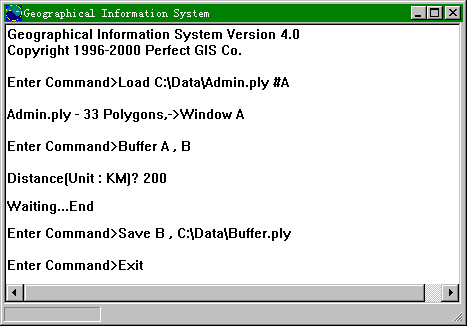
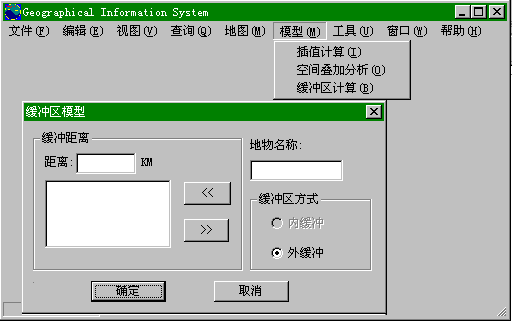
In the interface design of GIS software, there are three basic user interface styles, namely, command-based interface, menu-driven interface and workflow-based GUI interface. These three interfaces have their own advantages and disadvantages for implementation and use. In specific implementation, one or more styles can be supported at the same time. The command line is the simplest interface style and has long been used in a variety of operating system software. It uses only text language and requires users to know the options available, which requires memorizing various commands or constantly looking up help documents. The command-line-based interface does not provide any tips or suggestions, which makes users rely on printed documents to learn the system. Using the command line interface requires the development of a command line interpreter. In the command line interface software, the relationship between functional modules is relatively simple, often the output of one module is used as the input of another module, which is easy to develop and implement. Using batch command files or script files, you can perform multiple steps in turn, which is the advantage of the command line interface. For GIS software, because it contains a large number of graphical operations, when using the command line interface, there needs to be a graphical window to display the results of the operation, so the command line interface acts as a console. Because batch commands and script files are supported, the command line interface can be used to achieve batch, procedural, and time-consuming data processing. Fig. 251 GIS interface based on the command line # After MS-Windows has become the mainstream operating system on PC, menu-driven user interface has been adopted in almost all application software. It lists all the actions provided by the system according to the hierarchy, and the user can select and perform an action through the keyboard or pointing device, usually the mouse. Each menu item has corresponding help information, which is easy for users to refer to at any time. The biggest advantage of menu-driven interface is that it is friendly and easy for users to master the system. But for advanced users, it is often inflexible and inefficient compared with the command line interface. In GIS, batch data often need to be processed continuously, and it takes a long time to calculate. In this case, the menu interface becomes intolerable. Fig. 252 Menu driven GIS interface in Windows environment # In the graphical data flow interface, the operator controls the system through a “visual language” rather than strict text, in which the system uses graphical symbols to represent the functions it provides, called “icons”. Icons can represent not only operations, but also data or hardware devices. In the user interface based on data flow graph, users can use the “Drag and Drop” operation to achieve the corresponding operation (for example, you can drag and drop the icon representing the interpolation calculation onto the icon representing isoline data to perform isoline interpolation), design and organize the data processing flow. The data flow graph interface is suitable for systems with clear and relatively simple data flow, such as digital image processing software, but its disadvantage is that it is difficult to implement. Fig. 253 GIS graphical user interface with data flow diagram # GIS interface based on the command line (figure 16-15) #
Menu-driven GIS interface (figure 16-16) #
GIS graphical user interface using data flow diagram (figure 16-17) #