Most of the GIS software organizes the geographic landscape in a hierarchical way, and extracts the geographic landscape by themes. The whole data layer set of the same region expresses the content of the geographic landscape in the region. Each topic layer can be called a data layer. The data level can be expressed not only by point, line and surface layer files of vector structure, but also by layer file format of raster structure.
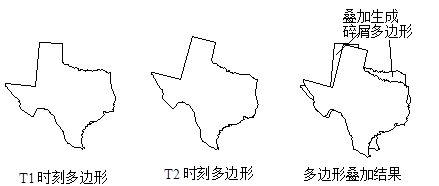
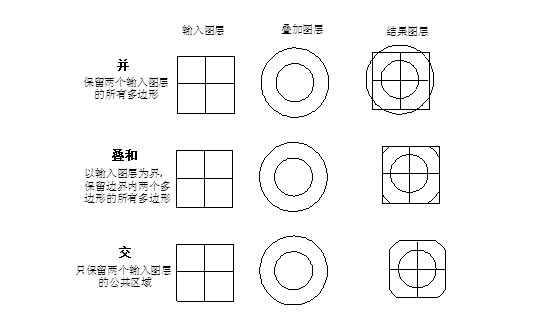
Overlay analysis is one of the most commonly used methods for extracting spatial implied information from GIS. The method is derived from the traditional superposition of transparent materials, which are to draw the drawings from different data sources on transparent paper, stack them together on the light-transparent table, and then use the pen to tick out the part of interest - extract the interest Information. The overlay analysis of GIS is to superimpose the data layer composed of the topic layers to generate a new data layer, the result combines the attributes of the original two or more layers. Overlay analysis includes not only the comparison of spatial relationships, but also the comparison of attribute relationships. GIS overlay analysis can be divided into the following categories: visual information overlay, point and polygon overlay, line and polygon overlay, polygon overlay, and raster layer overlay. Visual information overlay is to overlay the information content of different sides on the result map or screen, so that researchers can judge their spatial relationship and obtain more abundant spatial information. Visual information overlay in GIS includes the following categories: Overlay of point, line, and polygon symbols. The superposition of the area boundaries of a planar map or between a planar map and other thematic areas. Overlay of remote sensing imagery and thematic maps. Topic maps and digital elevation model (DEM) overlay to display stereo thematic maps. Visual information overlay does not produce new data layers, but shows multi-layered information, which is easy to analyze. Point and polygon overlay essentially computes the containment relationship between polygons and points. In vector based GIS, this spatial relationship judgment determining whether a point lies within a polygon,which is achieved by calculating the position of each point relative to the polygon segments. After the geometric relationship between the point and the polygon is calculated, the attribute information processing is also performed. The easiest way is to overlay the polygon attribute information onto the point in it. Of course, it is also possible to superimpose the attribute of the point on the polygon to identify the polygon, if there are multiple points distributed in a polygon, some special rules, such as the number of points or the sum of the attributes of the points are used, the information is overlayed on the polygon. By superimposing points and polygons, you can calculate how many points in each polygon type, not only to distinguish whether the point is inside the polygon, but also to describe the attribute information of the point inside the polygon. Usually, the new data layer is not directly generated, but the attribute information is superimposed on the original layer, and then the required information of the point and the polygon superposition is obtained indirectly through the attribute query. For example, a Chinese political map (polygon) and a national mineral distribution map (dot) are superimposed and analyzed, and the attribute information related to the polygon of the political map is added to the attribute data table of the mineral, and then through the attribute query, you can query how many kinds of minerals are produced in the designated province, and how much is produced; and you can inquire about the distribution of the specified types of minerals in which provinces. The overlay of lines and polygons is to compare the relationship between line coordinates and polygon coordinates to determine whether the line falls within the polygon. The calculation process usually calculates the intersection of the line and the polygon, as long as they intersect, a node is generated, the original line is broken into an arc segment, and the attribute information of the original line and the polygon are assigned to the new arc. The result of the superposition produces a new data plane, each line is broken into a new arc layer by the polygon it passes through, and a corresponding attribute data table is generated to record the attribute information of the original line and the polygon. According to the result of the superposition, it can be determined in which polygon each arc segment is in, and the length of the specified line in the specified polygon can be queried. If the linear layer is a river, the result of the superposition is that the polygon breaks all the rivers passing through it into arcs, and can query the length of the river in any polygon, and then calculate its river density; if the linear layer is a road network, the superimposed result can obtain the road network density within each polygon, the internal traffic flow, the traffic volume entering and leaving each polygon, and the mutual traffic between adjacent polygons. Point-in-polygon overlay is one of the most commonly used functions of GIS. Point-in-polygon overlay generates a new polygon layer by overlapping two or more polygon layers. As a result, the original polygon elements are divided into new elements, which synthesize the attributes of the original two or more layers. As shown in Figure 8-11: Fig. 120 Figure 8-11: Point-in-polygon overlay analysis # In the attribute space composed of polygons (for example, plot ID, plot number, soil ID, stability) in which multiple polygons are superimposed, the attribute values within each result polygon are consistent, which can be called Least Common Geographic Unit (LCGU). The overlay process can be divided into two steps: the geometric intersection process and the attribute assignment process. The geometric intersection process first finds the intersection of all polygon boundary lines, and then re-performs the polygon topology based on these intersection points, assigns a polygon unique identification code to each object of the newly generated topological polygon layer, and simultaneously generates a new polygon object, one-to-one correspondence attribute table. Due to the limited precision of the vector structure, the geometric objects may not be perfectly matched, and some superimposed polygons may appear in the overlay result, as shown in Figure 8-12, a fuzzy tolerance can usually be set to eliminate it. Fig. 121 Figure 8-12: The generation of clastic polygons by superposition of polygons # The result of polygon overlay usually divides a polygon into many polygons, the most typical method of attribute assignment is to copy the attributes of the input layer object into the attributes table of the new object, or to directly relate the identification of the input layer object to the attributes table of the input layer as a foreign key. The theoretical assumption of this attribute allocation method is that the attributes in polygonal objects are homogeneous, and the attributes remain unchanged after they are segmented. It also can assign attribute values to new polygons by combining various statistical methods. After the polygon overlay is completed, the attribute information of the original layer can be queried according to the attribute table of the new layer, as other layers, the newly generated layer can perform various spatial analysis and query operations. According to the different requirements of preserving spatial features in the end of the overlay results, general GIS software provides three types of polygon overlay operations, as shown in Figure 8-13: Fig. 122 Figure 8-13: Different overlay methods for polygons # The raster data structure features implicit spatial information and explicit attribute information, making it the most typical form of data layers. Establishing connections between different data layers through mathematical relationships is a fundamental function provided by GIS. Spatial modeling particularly requires overlaying various data layers through diverse equations to reveal specific spatial phenomena or processes. For instance, soil erosion intensity is influenced by factors such as soil erodibility, slope gradient, and rainfall erosivity. By inputting soil erodibility, slope gradient, and rainfall erosivity as data layers and performing mathematical operations based on empirically derived equations from long-term statistics, a soil erosion intensity distribution map can be generated. This mathematical overlay operation applied to different data layers is referred to as “map algebra” in GIS. Map algebra functionality can be categorized into three distinct types: Algebraic operations on data level based on constants; Mathematical transformation (exponential, logarithmic, triangular transformation, etc.) based on mathematical transformation at the data level; Algebraic operations (addition, subtraction, multiplication, division, multiplication, etc.) and logical operations (and, or, non, exclusive or, etc.) at multiple data levels. A typical example of map algebra is given below. There is an empirical model of snow melting in forest areas: Where M is the snow melting speed (cm/day), T is the air temperature, and D is the dew point temperature. According to this equation, using the temperature and dew point temperature distribution layers in the area, the snowmelt rate distribution map for the area can be calculated. The calculation process is to multiply the temperature profile by 0.19 and the dew point temperature profile by multiplying by 0.17, and then add the results. It should be noted that the map algebra is simple in form and concept, and is convenient and flexible to use, however, it is difficult to implement the technique by calculating the layer as a variable of the algebraic formula. Another form of raster overlay is binary logic overlay, which is often used as a database query tool of raster structure. Database query is to find the existing information in the database, such as location information query such as the land type of the known location, and attribute information query such as the location of the highest land price; more complex query involves a variety of complex conditions, such as query all wetlands with an area greater than 10 hectares and adjacent industrial areas. This kind of database query is usually divided into two steps. First, we reclassify (see Section 3) to create a new layer for each condition, which is usually a binary layer. One represents eligibility, and zero represents all non-eligibility. The second step is to perform the binary logic overlay operation to get the desired query results. Logical operation types include, or, non, exclusive or.Visual information overlay #
Point and polygon overlay #
Line and polygon overlay #
Point-in-polygon overlay #

Raster overlay #