In the process of GIS application project, control activities should run through the whole project, so as to avoid serious quality and time problems after the completion of the project. At each stage of the project, or after the completion of the whole project, post-analysis and evaluation can better understand the problems in the progress of the project, evaluate the project participants, and provide a reference for the next stage or similar project organization and management. In a sense, evaluation is an effective way to implement project control.
Usually, the object of post-analysis and evaluation includes:
Procedure: quantity and quality;
Data: quantity and quality;
Participants: working hours and efficiency;
Funds: usage and efficiency;
Equipment: occupancy and efficiency.
In the analysis and evaluation of the above factors, we should use the quantitative method as far as possible. On the one hand, the quantity can more accurately explain the progress and problems of the project, on the other hand, the quantity can also facilitate the horizontal and vertical comparison. Horizontal comparison refers to the comparison of different teams or even different personnel in a project. Longitudinal comparison refers to the comparison between different stages of a project or between different projects.
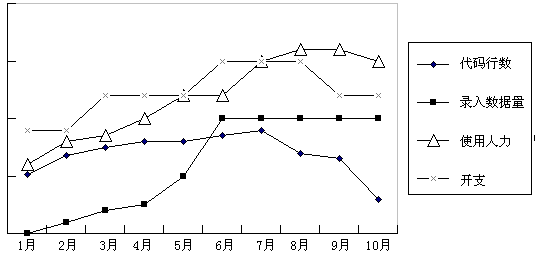
The results of analysis and evaluation can be expressed intuitively in the form of tables and statistical charts (Table 15-6, Figure 15-10). Project managers can evaluate the progress of work based on the results, identify problems and correct them in the next step.
Table 15-6: the analysis result of first phase of XX project (January 1999-October 1999)
Project | Value |
|---|---|
Program
Data
Staff
Funds
| 78532 130 1.65 places/thousands of rows 78 trillion 0.12mm 290 trillion 83% 140 person&months 82,000 RMB |
Table 15-6 lists the results of the analysis of various elements in the project from the total amount, which can be used as the basis for calculating the cost and efficiency of the project stage. Figure 15-10 better illustrates the progress of the project, which can make managers easily find the smooth and unfavorable time periods of the project progress, and then find the reasons, as the basis for the next stage of work management. The analysis chart of the whole project can be reused for the next similar project, cost-benefit analysis and schedule. Fig. 235 Reflecting the progress of the project through different indicators #