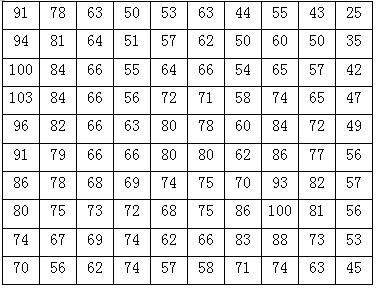
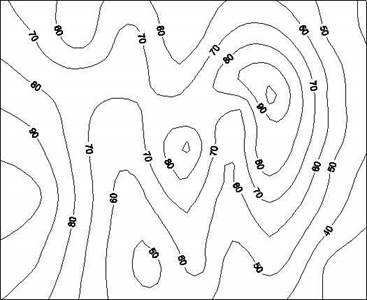
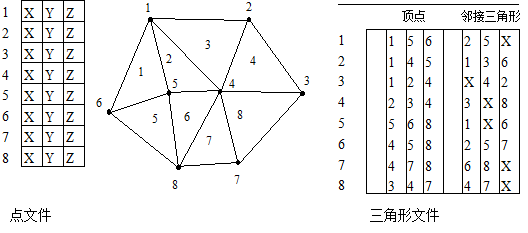
In GIS, the three main representation models of DEM are regular grid model, contour model and irregular triangular network model. Regular grids, usually square, can also be rectangular, triangular and other regular grids. The regular grid divides the area space into regular grid elements, each of which corresponds to a numerical value. Mathematically,which can be expressed as a matrix, and in computer implementation, it is a two-dimensional array. Each element of a grid cell or array corresponds to an elevation value, as shown in Figure 9-2. Fig. 132 Grid DEM # There are two distinct interpretations for the value of each grid cell. The first is the grid cell perspective, which regards the value of the grid cell as the elevation of all points within it, meaning the elevation across the ground area represented by the grid cell is uniform. In this case, the digital elevation model is a discontinuous function. The second is the point grid perspective, which considers the value of the grid cell as the elevation at the center of the grid or the average elevation value of the grid cell. This approach requires the use of an interpolation method to calculate the elevation of each point. To calculate the elevation value of any point that is not at a grid center, the elevation values of the four surrounding grid centers are used, and the distance-weighted average method is applied for computation. Alternatively, spline functions or Kriging interpolation may also be employed. The elevation matrix of regular grid can be easily processed by computer, especially the geographic information system of raster data structure. It can also easily calculate contours, slope directions, hillside shadows and automatically extract watershed topography, making it the most widely used format of DEM. At present, DEM data provided by many countries are in the form of regular grid data matrix. The disadvantage of grid DEM is that it can not accurately represent the structure and details of terrain, in order to avoid these problems, additional terrain feature data, such as terrain feature points, ridge lines, valley bottom lines and fault lines, can be used to describe the terrain structure. Another disadvantage of grid DEM is that the amount of data is too large, which brings inconvenience to data management. The lossless compression of DEM data can adopt common raster data compression methods, such as Run-Length coding, block code, etc., but because DEM data reflects the continuous fluctuation of terrain, it is usually more “fragmented”, and ordinary compression methods are difficult to achieve good results; therefore, for mesh DEM data, Huffman coding can be used for lossless compression; sometimes, at the expense of detailed information, lossy compression can be performed on the mesh DEM, the usual lossy compression is mostly based on Discrete Cosine Transformation (DCT) or Wavelet Transformation due to wavelet transform, which has better characteristics of maintaining details, in recent years, there have been many researches on applying wavelet transform to DEM data processing. The contour model represents elevation, and the set of elevation values is known, each contour corresponds to a known elevation value, so a series of contour sets together with their elevation values constitute a ground elevation model. As shown in Figure 9-3. Fig. 133 Contour # Contours are usually stored in an ordered sequence of coordinate points, which can be considered as a simple polygon or polygon arc with elevation attribute. Because the contour model only expresses part of the elevation value of the region, an interpolation method is often needed to calculate the elevation of other points falling outside the contour line, also due to these points fall in the area surrounded by two contours, the elevation of two contours is usually used to interpolate. Contours can usually be stored in a two-dimensional linked list. Another method is to represent the topological relationship of contours by graphs, to represent the regions between contours as nodes of graphs, and to represent the contours themselves by edges. This method satisfies two topological constraints: contour closure or boundary closure and disjoint contour. This kind of graph can be transformed into an acyclic free tree. The following figure is a contour map and its corresponding free tree (Fig. 9-4). Many other representation methods are based on graph theory. Fig. 134 Contours and corresponding free trees # Although regular grid DEM has many advantages in computation and application with many insurmountable shortcomings: In flat terrain, there is a large amount of data redundancy It is difficult to express the catastrophic phenomena of complex terrain without changing the size of the grid; In some computations, such as the visualization problem, the axis direction of the mesh is overemphasized. Triangulated Irregular Network (TIN) is another way to represent digital elevation models [Peuker et al., 1978], which reduces the data redundancy caused by the regular grid method while calculating the efficiency (such as slope), the aspect is better than the purely contour-based approach. The TIN model divides the region into connected triangular networks according to the finite set of points in the region, any point in the region falls on the vertex, edge or inside triangle of the triangle. If the point is not on the vertex, the elevation of the point is usually obtained by linear interpolation (the elevation of two vertices on the edge and three vertices in the triangle). So TIN is a piecewise linear model in three-dimensional space, which is continuous but not differentiable in the whole region. The data storage mode of TIN is more complex than that of grid DEM. It not only stores the elevation of each point, but also stores its plane coordinates, the topological relationship between nodes, triangles and adjacent triangles. TIN model is similar to the vector topology of polygon network in concept, but TIN model does not need to define the topological relationship between “island” and “hole”. Triangulated Irregular Network (TIN) is another way to represent digital elevation models [Peuker et al., 1978], which reduces the data redundancy caused by the regular grid method while calculating the efficiency (such as slope), the aspect is better than the Purely contour-based approach. The edge record has four pointer fields, including two pointers to the pointers of adjacent triangle records and the records of its two vertices; you can also record its vertices and adjacent triangles directly for each triangle (Figure 9-5). Each node includes three fields of coordinate values that store X, X, and Z coordinates, respectively. This topological network structure is characterized by a fixed length for a given triangle to query its three vertex elevations and adjacent triangles, and a higher efficiency when calculating terrain profiles along a straight line. Of course, other changes can be added to the structure to improve the efficiency of certain special operations, such as adding pointers to their associated edges in the records of the vertices. Fig. 135 A storage method for a triangulation network # The irregular triangulation digital elevation consists of continuous triangular faces, the shape and size of the triangular faces depend on the irregularly distributed measuring points, or the position and density of the nodes. The irregular triangulation differs from the elevation matrix method in that it changes the density of the sampling points and determines the position of the sampling points as the complexity of the terrain changes, so that it can avoid data redundancy when the terrain is flat, and can also be based on terrain features, such as ridges, valley lines, topographic lines, etc., represent digital elevation features. The Layer ofDetails (LOD) is a digital elevation model that expresses multiple levels of accuracy. Most hierarchical models are based on the irregular triangulation model, generally, the more data points of the irregular triangulation, the higher the accuracy, the less the data points, the lower the accuracy, but the more data points require more computing resources. So if the accuracy meets the requirements, it is best to use as few data points as possible. The hierarchical terrain model allows for the selection of terrain models of different precision for different mission requirements, the idea of a hierarchical model is ideal, but in practice it must pay attention to several important issues: Storage problems of hierarchical models, obviously, unlike direct storage, hierarchical data inevitably leads to data redundancy. The efficiency problem of automatic search, for example, searching for a point may first search at the thickest level, and then search at a finer level until the point is found. Optimization of the shape of the triangular mesh, for example, Delaunay triangulation can be used. Models may allow mixed models with different levels of detail, depending on the complexity of the terrain, for example, for flight simulations, terrain features that are more detailed near than far must be displayed. It should be consistent in expressing geomorphological features. For example, if there is an obvious mountain peak on a certain level of terrain model, this peak should also be present on a more detailed terrain model. At present, there is no recognized best solution to these problems, which still needs further study.Regular grid model #
Contour model #

Irregular Triangular Network (TIN) Model #
Hierarchical model #