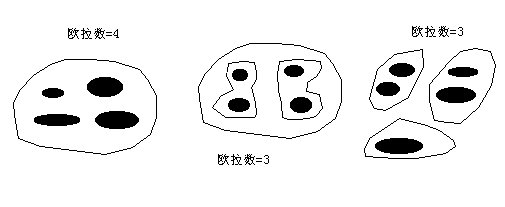
Searching and locating spatial objects, and quantifying spatial objects is one of the basic functions of GIS, which is the basis of high-level analysis of GIS. In order to carry out high-level analysis, it is often necessary to query and locate spatial objects, and describe the geographical distribution or phenomena with some simple measurements, such as length, area, distance, shape, etc in GIS. In fact, spatial analysis begins with spatial query and measurement, which is the quantitative basis of spatial analysis. Graphic and attribute mutual check is the most commonly used query, there are two main types: The first type is to query the location of the positioning space according to the requirements of the attribute information, which is called “attribute check graph”. For example, in the administrative division map of China, the provinces with a population of more than 40 million and a population of more than 10 million are not different from the SQL query of the general non-spatial relational database, after the results are obtained, the correspondence between the graphs and the attributes is used. Further, the results are mapped on the map by the specified display method. The second type is to query related attribute information according to the spatial location of the object, which is called “graphic check attribute”. For example, general GIS software provides an “INFO” tool to enable users to use cursors to select objects with clicks, lines, rectangles, circles, irregular polygons and other tools, and display a list of the attributes of the queried objects, which can be used for statistical analysis. The query is usually divided into two steps, firstly, the selected spatial entity is quickly retrieved in the GIS database with the spatial index, and then the attribute list of the queried spatial entity can be obtained according to the connection relationship between the spatial entity and the attribute. In most GIS, spatial queries are provided in the following ways: 1) Query based on spatial relationship There are many spatial relationships among spatial entities, including topology, order, distance and orientation. Searching and locating spatial entities through spatial relations is one of the functions of GIS which is different from general database system. If you query a city that meets the following criteria: On the east of the Beijing-Shanghai line No more than 50 kilometers from Beijing-Shanghai line The urban population is greater than 1 million The city selection area is a specific polygon; The whole query calculation involves spatial sequence and orientation (east of Beijing-Shanghai line), spatial distance (no more than 50 kilometers from Beijing-Shanghai line), spatial topological relationship (making the selected area a specific polygon), and even attribute information query (urban population is more than 1 million). Simple queries about the relationship between surface, line and point include: Surface queries, such as which polygons are adjacent to a polygon. Surface-to-line queries, such as which lines are on the boundary of a polygon. Face-to-point queries, such as what points are in a polygon. Line-to-surface queries, such as what polygons a line passes through, what are the left and right polygons of a chain. Line-to-line queries, such as which tributaries are connected to a river and which rivers are crossed by a road. Line-to-point queries, such as which bridges are on a road, which substations are on a transmission line. Point-to-surface queries, such as which polygon a point falls into. Point-to-line queries, such as which lines intersect a node. 2) Query based on spatial relationship and attribute characteristics The traditional SQL of the relational database does not handle spatial queries, this is due to the weakness of relational database technology, for GIS, SQL needs to be extended. For traditional SQL, to implement spatial operations, SQL commands need to be embedded in a programming language, such as C; while new SQL allows users to define their own operations and embed them into SQL commands. 3) Address matching query It is a unique query function of GIS to query the spatial location and attribute information of things according to the street address., this query uses geocoding to input the street number, so that we can know the approximate location and block. It is very helpful for the social and economic survey and statistics of spatial distribution, as long as the address is added to the questionnaire, the GIS can automatically analyze various economic and social survey data from the perspective of spatial location. In addition, such queries are often used in public utilities management, accident analysis, etc., such as postal, communications, water supply, power supply, security, fire, medical and other fields. Geometric measurement has different meanings for different points, lines and surface objects. Point objects (0 dimensions): coordinates; Linear objects (1 dimension): length, curvature, direction; Surface features (2-D): area, circumference, shape, curvature, etc. Body features (3-D): volume, surface area, etc. Generally, GIS software has the function of geometric measurement of point, line and area objects, either for vector data structure or for spatial data of raster data structure. 1) Calculation of line length Length is one of the most basic morphological parameters of linear objects. In the vector data structure, the line is expressed as a sequence of coordinates (X, Y) or (X, Y, Z) of points, without considering the scale, the formula for calculating the line length is as follows: For composite linear objects, the length of each branch curve should be calculated before the sum of its lengths can be calculated. It is very important to express the line object by discrete coordinate point pair string, and choose the point selection scheme that reflects the shape of the curve, often, due to different selection schemes, different precision problems of length calculation will be brought. In order to improve the calculation accuracy and increase the number of points, it will bring additional burden to data acquisition, management and analysis, the compromise point selection scheme is to increase the number of points at the corners of the curve and reduce the number of points in the straight sections to achieve the required calculation accuracy. In raster data structure, the length of linear objects is the number of grids through which the skeleton lines of objects are accumulated, the skeleton lines are usually connected in eight directions, and multiplied when the connection direction is diagonal. 2) Area of planar features Area is the most basic parameter of surface features. Under the vector structure, surface objects are represented by polygons formed by arcs of their contour boundaries. For simple polygons without voids, suppose that there are N vertices, and the formula for calculating their area is as follows: The method of geometric intersection is adopted, that is, perpendicular to the X-axis is made along each vertex of the polygon, and then the area surrounded by each side,which two perpendicular lines and the part of the X-axis truncated by the two perpendicular lines is calculated, the algebraic sum of the area obtained is the area of the polygon. For polygons with holes or inner islands, the area of outer polygon and inner island can be calculated separately, and the difference is the area of original polygon, this method is also suitable for volume calculation. For grid structure, polygon area calculation is to count the number of grid with the same attribute value. However, the calculation of the area of broken polygon is special, which may be necessary to calculate the area of a particular polygon, it must be reclassified, each polygon is divided into separate attribute values, and then the statistics are carried out. Two basic considerations in shape measurement of surface objects are spatial consistency, that is, the processing of porous polygons and broken polygons, and the description of polygonal boundary features. Euler function is the most commonly used index for measuring spatial consistency, which is used to calculate the degree of fragmentation of polygons and the number of holes. The result of Euler function is a number, called Euler number. The calculation formula of Euler function is as follows: Figure 8-1 shows three possible scenarios for polygons. Fig. 110 Euler number # For Figure (a), the Euler number = 4 - (1 - 1) = 4, or the Euler number = 4 - 0 = 4; For Figure (b), the Euler number = 4 - (2 - 1) = 3, or the Euler number = 4 - 1 = 3; For Figure (c), the Euler number = 5 - (3 - 1) = 3. For the problem of polygon boundary description, it is difficult to find an accurate index to describe the surface features because their appearance is complex and changeable. The most commonly used indicators include the ratio of polygon length to short axis, the ratio of perimeter to area, and the ratio of area to length. Most of them are based on area and perimeter. It is generally considered that a circular object is neither compact nor expansive, and its shape coefficient r can be defined as: Where P represents the perimeter of the feature and A represents the area. If r < 1, it is a compact type; if r = 1, it is a standard circle; if r > 1, it is an expanded type. Centroid is an important index to describe the spatial distribution of geographical objects. For example, to obtain a national population distribution contour map, and the population data can only go to the county level, it is necessary to define a point in each county as the centroid, representing the county’s numerical value, and then interpolating to calculate the national population contour. The centroid is usually defined as the geometric center of a polygon or polygon, when the polygon is relatively simple, such as a rectangle, the calculation is easy. But when the shape of the polygon is complex, the calculation is more complicated. In some cases, the center of mass describes the center of distribution rather than the absolute geometric center. Similarly, taking the population of the whole country as an example, when the vast majority of the population of a county is obviously concentrated on one side, the center of mass can be placed on the distribution center, which is called the average center or center of gravity. If other factors are taken into account, weight coefficients can be given, which are called weighted average centers. The calculation formula is as follows: Where Centroid measurements are often used for macroeconomic analysis and market location selection, as well as for tracking changes in certain geographic distributions, such as demographic changes and land type changes. Distance is a concept often involved in people’s daily life. It describes the distance between two things or entities. The most commonly used concept of distance is Euclidean distance, which is easy to implement in both vector and grid structures. In GIS, distance is usually calculated between two locations, but sometimes people want to know the distance from one location to all other locations, when the distance is a distance surface. If all the properties in a region are independent of direction, they are called isotropic regions. Taking travel time as an example, if the time spent from one point to another is only proportional to the Euclidean distance between the two points, then starting from a fixed point, the points that can be reached after a specific time of travel will inevitably form an isochronal circle. In real life, the time spent on travel is not only proportional to the Euclidean distance, but also related to road conditions and vehicle performance. from a fixed point, the points that can be reached after a certain time of travel are different distances in all directions, form an anisotropic distance surface. (Figure 8-2) Fig. 111 Isotropic and anisotropic distant surfaces # Considering the effect of drag, the calculated distance is called consumptive distance. Material moves in space at a cost of money, time, etc., the greater the resistance, the greater the cost. The corresponding distance surface obtained by the consumption distance is called resistance surface or consumption surface, and its attribute value represents a consumption or resistance. The minimum cost distance can be calculated according to the resistance surface. For describing the vector structure of point, line and surface coordinates, there are also a series of concepts different from Euclidean distance. Euclidean distance is usually used to calculate the straight line distance between two points. When there is obstacle or resistance, the distance between two points can not be calculated by straight line distance, the general formula for calculating non-standard Euclidean distance is as follows: When k=2 , it becomes the Euclidean distance formula. When k=1 , the resulting distance is referred to as the Manhattan distance. The calculations for Euclidean distance, Manhattan distance, and non-Euclidean distances are illustrated in Figure 8-3. Fig. 112 Euclidean distance, Manhattan distance and a non-Euclidean distance # Spatial query #
Spatial computation #
Geometric measurement #
Shape measurement #
Euler_number = (number_of_holes) - (number_of_pieces - 1)
Centroid measurement #
W_i
is the i-th discrete target weight,
X_i
,
Y_i
is the coordinate of the i-th discrete target.Distance measurement #

