Cartographic generalization
The research and development of integrated functions of geographic information in geographic information system (GIS) is a new challenge facing the progress and application development of GIS. With the rapid development of GIS technology and application, the problem of effective utilization and expression of geographic information in GIS becomes more and more prominent. Therefore, people have to start to pay attention to the comprehensive function of geographic information in GIS, derive more useful information of multi-scale, multi-purpose and multi-topic from basic scale data, and improve the efficiency of the expression and utilization of geographic information, so as to meet the needs of visualization and various analysis and cartographic output of GIS.
Concept of cartographic generalization
Cartographic generalization is the choice and simplification of objective things in cartographic area. After generalization, maps can show the main things and essential characteristics. The scale, use and theme of maps, geographical features of cartographic regions and graphic dimensions of symbols are the main factors affecting cartographic generalization. Cartographic generalization is mainly manifested in the selection of content, simplification of quantity, simplification of quality and simplification of shape.
The essence of thematic map generalization is to generalize the thematic content of a map according to its use and scale on the basis of scientific analysis of the characteristics of various thematic content elements, and to reflect the most important elements, the basic outline of the object, the main features and the basic rules on the map. Thematic map generalization is based on geometry and geography. In terms of geometry, the shape and size of cartographic objects are simplified comprehensively, and in terms of geo-rationality, the thematic contents are summarized comprehensively. Cartographic synthesis is the close combination of geometric correctness and geographical authenticity.
Main factors affecting cartographic generalization
The degree of cartographic generalization is influenced by various factors, such as the scale of the map, the theme and use of the map, the geographical characteristics of the cartographic area and the size of the symbols.
Map scale
The influence of scale on cartographic generalization is very obvious. Because of the reduction of scale, the area of the same mapping area on the map will be reduced, so the number of objects that can be represented on the map will be reduced accordingly. When the map size is fixed, the field coverage of different scale maps is different, large scale maps include smaller ground area and small scale maps include larger ground area. In different ranges, the evaluation of the importance of the same object is not the same, some things are important in a small range, but may be secondary in a large range.
Use of maps
The content of any map is limited and can only meet the requirements of one aspect or several aspects, therefore, the selection and expression of map content must take into account the use of the map. Since the use of maps directly determines the content of maps, which affects cartographic generalization. For example, 1:500,000 scale topographic maps and 1:500,000 scale administrative district maps, because of their different uses, the selection and simplification of map content are very different. 1:500,000 scale topographic map is one of the basic topographic maps of the country, which is used for military campaign, economic planning and scientific research. On this map, the basic natural and socio-economic conditions of the mapping area should be fully reflected; on the other hand, 1:500,000 scale administrative map is used for administrative management and deployment by provincial organs. It mainly expresses the social and economic elements (such as boundary, residential area, transportation line, etc.), while it can make a larger summary of the natural elements (such as topography, soil quality, vegetation, etc.).
Topics of maps
The theme of the map is the main content reflected on the map, which decides the importance of everything on the map, thus affecting the degree of cartographic generalization. This is particularly evident on thematic maps, such as two maps with the same scale but the same theme, one for topographic maps and one for political district traffic maps. The former mainly represents topographical features and water systems, with fewer residential areas. Does not mean railways and highways; the latter focuses on administrative divisions, railways and major roads, administrative centers at all levels, and residential areas as transportation hubs. For water systems, only the main rivers and lakes are indicated, and generally do not represent topography.
Geographical characteristics of cartographic regions
The geographical characteristics of cartographic region refer to the natural and socio-economic conditions of the region. Different regions on the ground have different geographical characteristics. Therefore, when cartographic generalization, it is necessary to select those things that can reflect the regional characteristics, leaving out those things that do not represent the regional characteristics. The same geographical things have different meanings in different regions, which affects cartographic generalization. For example, small towns are secondary in densely populated areas, which are generally not shown on the map, while in sparsely populated areas, small towns become the main residential areas, which should be selected on the map.
Graphic dimensions of symbols
All kinds of geographical things are represented by symbols on the graph. The graphics and dimensions of symbols are directly related to the load of maps, and thus affect the degree of cartographic generalization. If the size of the map is smaller, the content can be selected more, the generalization degree is smaller, the content of the map will be more detailed, and the load of the map will be larger; on the contrary, the content of the map will be simpler and the load of the map will be smaller. In addition, the minimum size of the geometric figure is related to the structure and complexity of the figure. The minimum size of the contour symbol is affected by some factors such as the form of the contour boundary, the internal color and the background, which can be seen that the minimum size of the symbolic figure is the necessary reference data to determine the cartographic synthesis.
Visualization requirements
Visualization is the window of geographic information processing and the intuitive expression of processing results, so it is the direct basis for decision-making. Only by transforming the massive data in spatial database into intuitive graphic information can the results of geographic information processing provide strong support for planning, management and decision-making.
Basic methods of cartographic generalization
Cartographic synthesis is a highly intelligent and creative operation process, it is a whole task, including a series of operations of different nature, which can be decomposed into several sub-processes to achieve. Due to the lack of clear internal or logical connections between these sub-processes, these sub-processes are combined in some mixed form. Different scholars have proposed different decomposition modes for cartographic generalization process: three operator modes: selection, generalization and shift; four operator modes: selection, generalization, merge and shift; seven operator modes: pure geometric generalization includes simplification, exaggeration and displacement; and geometry/concept generalization includes selection, merge typification and emphasis.
The content of traditional cartographic generalization mainly includes: selecting the main objects and determining the selection criteria of the main objects; generalizing the quantitative characteristics, mainly starting from reducing classification and changing the presentation method; combining the quality characteristics, merging some similar classification and classification, using combination symbols instead of single symbols; simplifying the contour graphics, including simplifying the symbolic lines and contour boundaries; combining small area patches into large area contours, exaggerating small area contours with characteristics, removing some small indicators and transforming them into general indicators, etc.
Heuristic cartographic generalization is to decompose the whole optimization process into several sub-processes, which are basically equivalent to some methods of traditional cartographic generalization (such as selection, generalization, merging and displacement). In the process of generalization, for example, the generalization of curved coastlines means the choice of the appropriate harbour or cape. The British Coastline Length problem is a typical problem in the emerging subject of fractal science. Fractal geometry is used to describe self-similar structures with multi-layer nesting which are difficult to describe by Euclidean geometry. The river system in the map, the furrows and forks in the landform, the avenues, alleys, lanes and lanes in the city all have nested features, and are typical fractal structures. Fractal geometry principle will be applied in map information processing.
Fractal:
Fractal is a word created by B. Mandelbrot with Latin roots, meaning thin, broken, scored, graded, etc. It is a collection of partial and overall similarities in some way [B. Mandelbrot]. Fractals have the following characteristics:
It has fine structure, and under any small scale, there are always complex details.
Fractal is irregular, its whole and part can not be described by traditional geometric language.
It usually has the form of self-similarity, which can be approximate or statistical.
Generally, the fractal dimension under some definition of fractal is larger than its topological dimension, for example, on a plane, the dimension of a fractal curve is between 1 and 2.
In most cases, fractals are determined in a very simple way and can be generated by an iterative process.
Fractal is a powerful tool for describing irregular geometry. Many objects in nature have fractal characteristics, such as coastline, topography, clouds, and even organisms. For a coastline, it is always tortuous whether viewed from remote sensing satellites or from cliffs on the shore. Therefore, it is impossible to describe the geometric shapes of these objects accurately, in the process of digitalization of GIS, sampling operations should be carried out.
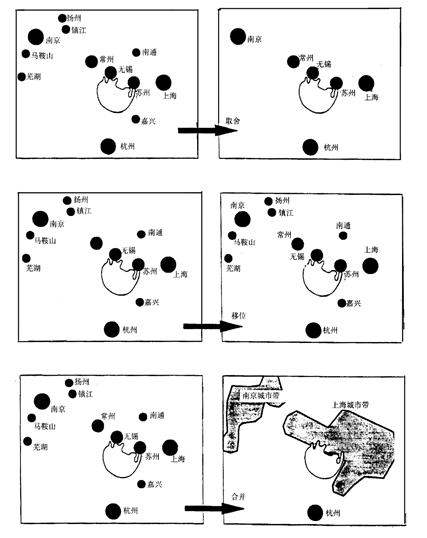
Figure 11-18: Synthesis of dot symbols
In a word, the basic methods of cartographic generalization are content selection, quantity simplification, quality simplification and shape simplification. Figs 11-18, 11-19 and 11-20 are the synthesis of dot symbols, line symbols and area symbols, respectively.
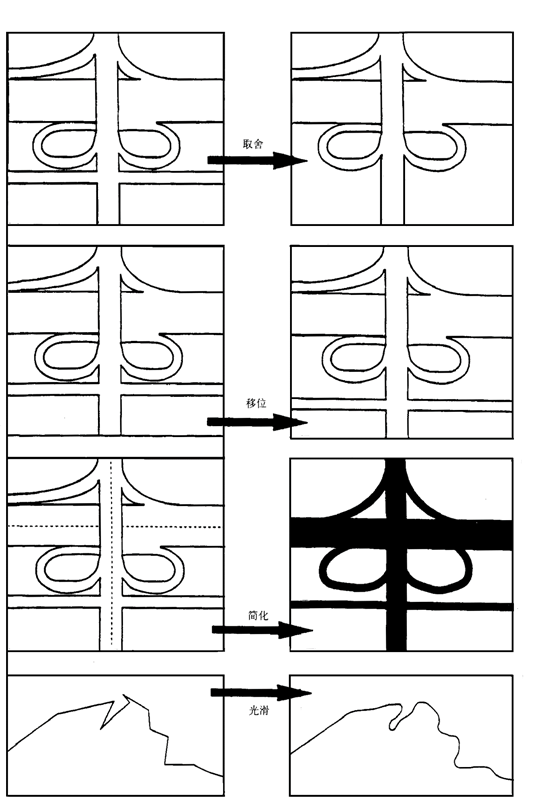
Figure 11-19: The synthesis of line symbols
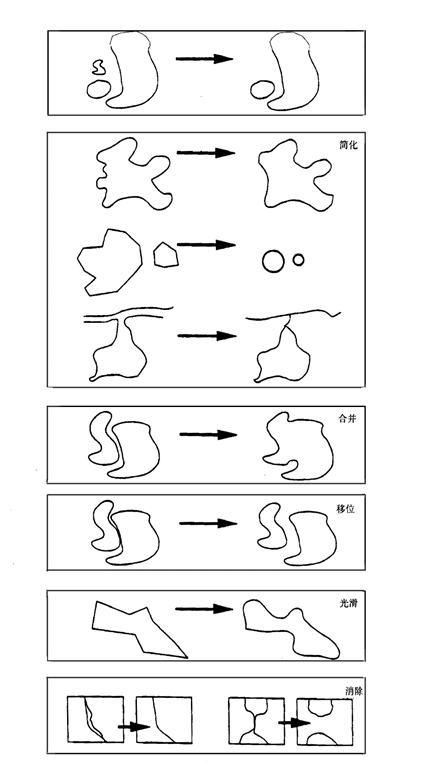
Figure 11-20: Synthesis of face symbols
Choice of content
Content selection refers to the selection of larger, main content rather than smaller, secondary or unrelated to the map theme. Selection is mainly manifested in: one is to select the main categories, and the other is to select the main things in the main categories. Abandonment is mainly manifested in the following aspects: first, the abandonment of secondary categories; second, the abandonment of secondary things in selected categories. Note that the so-called primary and secondary are relative. It varies with the theme, purpose and scale of the map. The selection of map contents is generally carried out in the following order:
From the whole to the part: When choosing, we should first focus on the whole, and then start from the part.
From primary to secondary: according to the theme and purpose of the map, there are always primary and secondary elements on the map. Selection should follow the order of primary and secondary.
From high to low: This ensures that the higher can be selected without missing out.
From big to small: This ensures that big things are first chosen.
In short, the selection should start from the overall point of view, first select the main, high-level, large-scale things, then select the secondary, low-level, small things in turn, and finally analyze the whole to see whether it reflects the overall characteristics of the cartographic area.
Simplification of quality characteristics
The quality differences of things on maps are usually expressed by classification. The simplification of quality characteristics is to reduce the quality difference of things within a certain range, and replace the detailed classification with the general classification, that is, merge the things of similar type or grade according to the nature of things. For example, coniferous forests, broad-leaved forests and mixed forests are merged into forests; karst mountains, karst hills, karst platforms and karst dissolution accumulation basins are merged into karst landforms.
Simplification of quantitative characteristics
The simplification of the quantitative characteristics is to reduce the difference in the number of things, increase the spacing of the internal changes of the quantitative indicators, and not to indicate the things whose quantity indicators are lower than the specified level. On maps where the number features are represented by contours, the contour spacing values are expanded when simplification. When simplification of quantity characterization, not only the scale and use of the map, but also the characteristics of the distribution of the number of things and the grading limits of quality significance should be considered.
Shape simplification
Shape reduction is used for linear and planar distribution of things. The purpose of shape reduction is to preserve the inherent and typical features of things. The simplification methods include deletion, exaggeration and merger. Deletion is the removal of fragments that cannot be clearly expressed because of the reduction in scale. Sometimes, in order to show and emphasize the features of plane graphics of things, small bends that should be deleted proportionally are exaggerated. Merging is the merging of adjacent, spaced to indistinguishable graphics of similar things to show the overall characteristics of things. When simplifying the shape of something, we should take into account the relationship with other things so that they can be in harmony with each other. For example, when simplifying the shape of lakes, we should pay attention to the relationship with topography and water system.