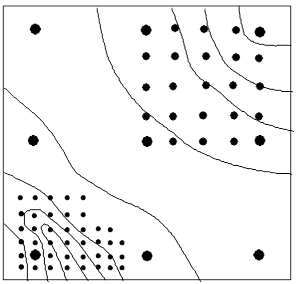
In order to establish DEM, it is necessary to measure the three-dimensional coordinates of some points, which is DEM data acquisition. 1) Ground measurement The field is measured in the field using an automatically recorded rangefinder theodolite (common electronic speed theodolite or total station theodolite). Such speed measuring theodolites generally have a microprocessor that can automatically record and display relevant data, and can also perform calculations on a variety of stations. The recorded data can be processed into the computer through serial communication. 2) Existing map digitization The digitizer is used to digitize the information on existing maps, such as contour lines, at present, the commonly used digitizers are handheld tracking digitizer and scanning digitizer. 3) Space sensor Data acquisition utilizing the Global Positioning System (GPS), combined with radar and laser altimeters. 4) Digital photogrammetry method This is one of the most commonly used methods for DEM data acquisition. The data can be obtained by manual, semi-automatic or full-automatic measurements using the stereo mapping instrument or coordinate instrument, analytic mapping instrument and digital photogrammetry system with an automatic recording device (interface). Digital photogrammetry is the most effective means of spatial data acquisition with the advantages of high efficiency and low labor intensity. Data sampling can all be done manually, which is often time consuming and error prone; semi-automatic sampling can assist the operator to sample to speed up and improve accuracy, usually by manually controlling the elevation Z, which is automatically controlled by the machine to control the plane coordinates X, Y; the fully automatic method uses computer vision instead of stereoscopic observation of the human eye, although the speed is fast, but the accuracy is poor. Data acquisition by manual or semi-automatic means can be divided into “point mode” or “flow mode”, the former records static measurement data according to control signals, while the latter records dynamic measurement data continuously according to certain rules. Photogrammetric methods are used in DEM production, the sampling methods of data points vary according to the requirements of products. Sampling along contours, sectional lines and geographic lines is often purposeful. Many products require elevation matrix form, so surface sampling based on regular grid or irregular grid points is necessary, this method is the same as other spatial attributes, but the sampling density is higher. 1) Sampling along the contour line In complex and steep terrain areas, contour tracking can be used for data acquisition, while in flat areas, contour sampling is not suitable. Sampling along contours can be done by recording data at equal intervals or at equal intervals. In the latter way, because the tracking speed is slower in places with large contour curvature, the collected points are denser, while in places with flat contour, the tracking speed is faster and the collected points are sparse, so as long as the proper time interval is chosen, the recorded data can describe the terrain well, and there will be not too much data. 2) Regular grid sampling Using the analytical mapper to sample in a three-dimensional model according to a regular rectangular grid, directly forming a regular grid DEM. When the system drives the measurement to the grid point, it will stay for a short time (such as 0.2 seconds) according to the pre-selected parameters for the operator to accurately measure. The method has the advantages of simple method, high precision and high working efficiency; the disadvantage is that the flexibility of the scale of the surface change is poor, and the feature points may be lost. 3) Progressive Sampling The purpose of the progressive sampling method is to make the sampling points have a reasonable distribution, that is, there are few samples in the flat area, and there are many samples in the complex terrain. Progressive sampling is first sampled at a predetermined sparse interval to obtain a sparse grid, and then analyzes whether the grid needs to be encrypted, as shown in Figure 9-12. Determining whether the encryption method can utilize whether the second-order difference of the elevation exceeds a given threshold; or use a neighboring three points to fit a quadratic curve, calculate the difference between the quadratic interpolation value of the midpoint between the two points and the linear interpolation value, and determine whether the threshold value is exceeded. When the threshold is exceeded, the grid is encrypted and sampled, and then the same judgment process is performed on the dense grid until it is no longer exceeded or reaches a predetermined number of encryptions (or minimum grid interval), and then perform the same processing on other grids. Fig. 142 Progressive sampling # 4) Select sampling In order to accurately reflect the terrain, the sampling can be selected according to the topographical features, such as collecting along the ridgeline, valley line, fault line, and the collection of discrete broken points (such as the top of the mountain). The data obtained by this method is especially suitable for the establishment of irregular triangulation DEM. 5) Mixed sampling In order to synchronously consider the efficiency and rationality of sampling, we can combine regular sampling (including progressive sampling) with selective sampling for hybrid sampling, i.e. sampling along feature lines and points on the basis of regular sampling. In order to distinguish common data points from feature points, different feature codes should be given to different points so that processing can be carried out in different ways. A regular grid DEM with additional topographical features can be established using hybrid sampling, and an irregular triangular mesh DEM with additional features can also be created. 6) Automated DEM data collection The above methods are based on a semi-automatic method for DEM data acquisition based on a analytical mapper or a machine-assisted mapping system, which is now possible to fully automate DEM data acquisition using an automated mapping system. At this time, digital image matching can be used for data acquisition according to the regular grid on the photo. Finally, the DEM data points acquired by digital photogrammetry should be converted into regular grid DEM or regular triangular network DEM format data according to certain interpolation methods. Data acquisition is the key problem of DEM. The results show that any DEM interpolation method can not compensate for the information loss caused by improper sampling. Too few data points will reduce the accuracy of DEM; too dense data points will increase the amount of data, processing workload and unnecessary storage. Before DEM data acquisition, it is necessary to determine a reasonable sampling density according to the required accuracy requirements, or to dynamically adjust the sampling point density according to the terrain complexity in the process of DEM data acquisition. Since many DEM data are derived from topographic maps, the accuracy of the DEM is never higher than the original topographic map. For example, U.S.G.S. uses a digitized contour plot, the maximum mean square error (RMSE) of the most accurate DEM produced by linear interpolation is half the pitch of the contour, and the maximum error is no more than two contour spacings, the DEM, which is usually produced by a mathematical fit to the surface, often has an unknown accuracy problem, even if the officially published topographic map has some kind of error, which should be noted in the production and use of the DEM. The data quality of DEM can be referenced to the U.S.G.S. classification standard, which is divided into three levels: Level 1: maximum absolute vertical error of 50 meters and maximum relative vertical error of 21 meters, with the vast majority of 7.5-minute quadrangle products belonging to Level 1. Level 2 DEM data has undergone smoothing and modification processes for error correction. DEMs produced through digitized contour interpolation belong to Level 2, with a maximum error of two contour intervals and a maximum root mean square error of half a contour interval. Level 3 DEM data has a maximum error of one contour interval and a maximum root mean square error of one-third contour interval.DEM data acquisition method #
DEM acquisition by digital photogrammetry #
DEM data quality control #