Undoubtedly, health is one of the most concerned issues in human life. Considering the following factors, the application of GIS in the field of health care will help to solve health problems and formulate corresponding policie.
Some diseases are limited to some areas (endemic diseases). It is of great significance to explore the local natural and social conditions for the study of the causes and treatment of diseases.
Medical facilities (hospitals, clinics, first aid centers, etc.) have spatial distribution characteristics. Rational distribution of medical facilities in a region is conducive to the effective use of resources.
GIS and Epidemiological Research #
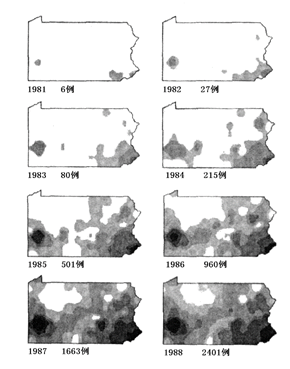
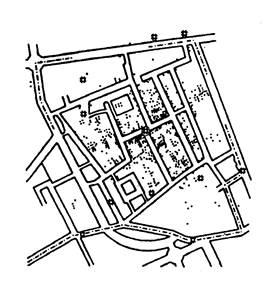
The epidemiology is used to describe and explain the incidence of a disease. As a view of spatial point, epidemiology needs to describe the spatial distribution characteristics of epidemic incidence, and then we can study the incidence model to discover the relationship between epidemics and the surrounding environment. Generally, the functions of GIS in epidemiological research are as follows: It is assumed that a set of points is used to represent the incidence of a population, and that data can only be obtained from the whole region, such as census areas or other administrative divisions, which include the incidence of diseases and the age structure of diseases. Because the size of each spatial area is different, the spatial distribution of incidence is not intuitive. One solution is to use a comparative statistical map (Cartogram). On the comparative statistical map, the size of each unit is proportional to the number of population at risk of disease, and then the incidence rate is plotted on the map, so that the epidemic data can be clearly visualized the spatial distribution by using GIS (Fig. 14-13). Fig. 224 The spread of AIDS in Pennsylvania from 1981 to 1988, # The grey areas on the graph grow in geometric series vividly shows the spread of AIDS In fact, the boundaries between spatial data visualization and spatial data analysis are very vague. For example, making comparative statistical maps needs to transform the geographic space. Because the distribution of population in different regions is uneven, in order to analyze the spatial distribution of epidemic cases, a commonly used method is called Density Estimation. In this method, a moving window is used to cover the rasterized position points and calculate the density of each window. The key to this method is to determine the size of the window. In addition, calculating the relationship between incidence density and population density, clustering analysis of case spatial distribution, and exploring the specific characteristics of each specific clustering area can be applied to the spatial analysis of epidemiological data. After identifying the spatial distribution clusters of each epidemic, a key study is to determine the relationship between the epidemic and its surrounding environment, which will help to verify the hypothesis of the cause of the epidemic. One approach is to compare the spatial distribution of air and water quality with that of epidemics. For example, in the study of malaria transmission in Africa, the NDVI index calculated from remote sensing images is used to model. In addition, in order to get the origin of the epidemic, distance analysis is usually used to calculate the buffer zone according to the presumed origin of the disease, and then get the number of cases within each distance range, so as to determine the real origin of the disease. Spatial analysis was used to determine the cause of the disease. The most famous case was that British doctor Joan Snow used a map to find the source of cholera: During the cholera epidemic in London, England, from August to September 1854, the authorities could not find the cause of the disease. Later, Dr. Joan Snow, a doctor, plotted the location of each cholera victim’s home on a 1:6500 urban map (Fig. 14-14) with all the roads, houses and drinking water wells in the cholera-endemic area, and obtained the distribution map of the location of the cholera victim’s residence. He analyzed the map. It immediately became clear where the source of cholera was that the homes of the deceased were concentrated in and around the areas where they drank the well water of Blodosto. According to Dr. Snow’s analysis and request, the authorities removed the pump from the well on 8 September, and no new cholera patients have appeared since. Fig. 225 Distribution of Cholera Dead Persons’Residence Location in the Cholera-endemic Areas of the United Kingdom in 1954 # Visualization of epidemiological data #
Spatial Data Analysis #
Epidemic models #
GIS and Medical Facilities Distribution #
Medical facility planning #
Whether in developed or developing countries, with the continuous acceptance of the view that “planning needs to proceed from local realities”, a medical center-based view has also been adopted. This means that instead of investing in large medical bases for the sake of so-called prestige, more clinics for small communities will be built for the convenience of the public. At this time, it is clear that a way is needed to provide detailed information on demographic and morbidity requirements for medical facilities. GIS can play an important role in positioning such medical facilities. Figure 14-15 shows that in the West Sussex study, the rationality of medical facility planning in the region is judged by determining patient-to-doctor flow. Fig. 226 The main direction of patient-to-general practitioner flow # 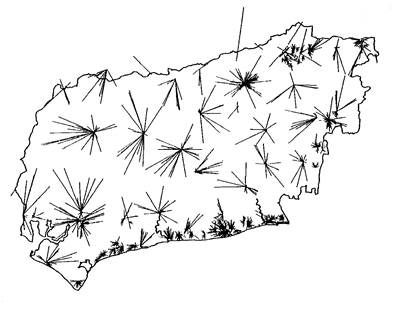
It reflects the “west Sussex” of every general practitioner
After defining the medical needs area, in order to assess the needs of the local residents, it is usually necessary to classify the survey data obtained by socioeconomic classification in order to better describe those small areas. In this way, data on different classes of people with different lifestyles or links between different lifestyles and morbidity and mortality can be obtained. Then the standardized incidence rate is extended to individuals through the situation of this class, and a comprehensive disease index is produced and applied to practice. This comprehensive disease index can be used to predict drug expenditure of patients.
Accessibility, availability and results #
GIS is helpful in understanding the relationship between medical outcomes and accessibility of medical facilities. For some diseases, such as traffic accidents, it is very important for patients to be rushed to the hospital quickly. This requires that the hospital has good accessibility. Discussing the relationship between accessibility and medical treatment is also helpful for planning medical facilities.
Linking Epidemiology with Medical Implementation Planning-Spatial Decision Support System #
In medical geography, Geo-epidemiology and medical facility planning are the two most important fields. To build a bridge between them, we need to include spatial decision support system (SDSS). If the analysis shows that there are health problems in special local areas, SDSS will provide tools and strategies to deal with this problem. In the study, the following problems are found to be noteworthy:
Map scale, small scale map will cover up many important issues in detail, such as inter-regional incidence changes. Large-scale maps allow authorities to focus on areas where they are most needed.
The spread of diseases is borderless. With the expansion of human activities, diseases also spread. Through population flow mapping, we can study the spread of diseases.